
.png)


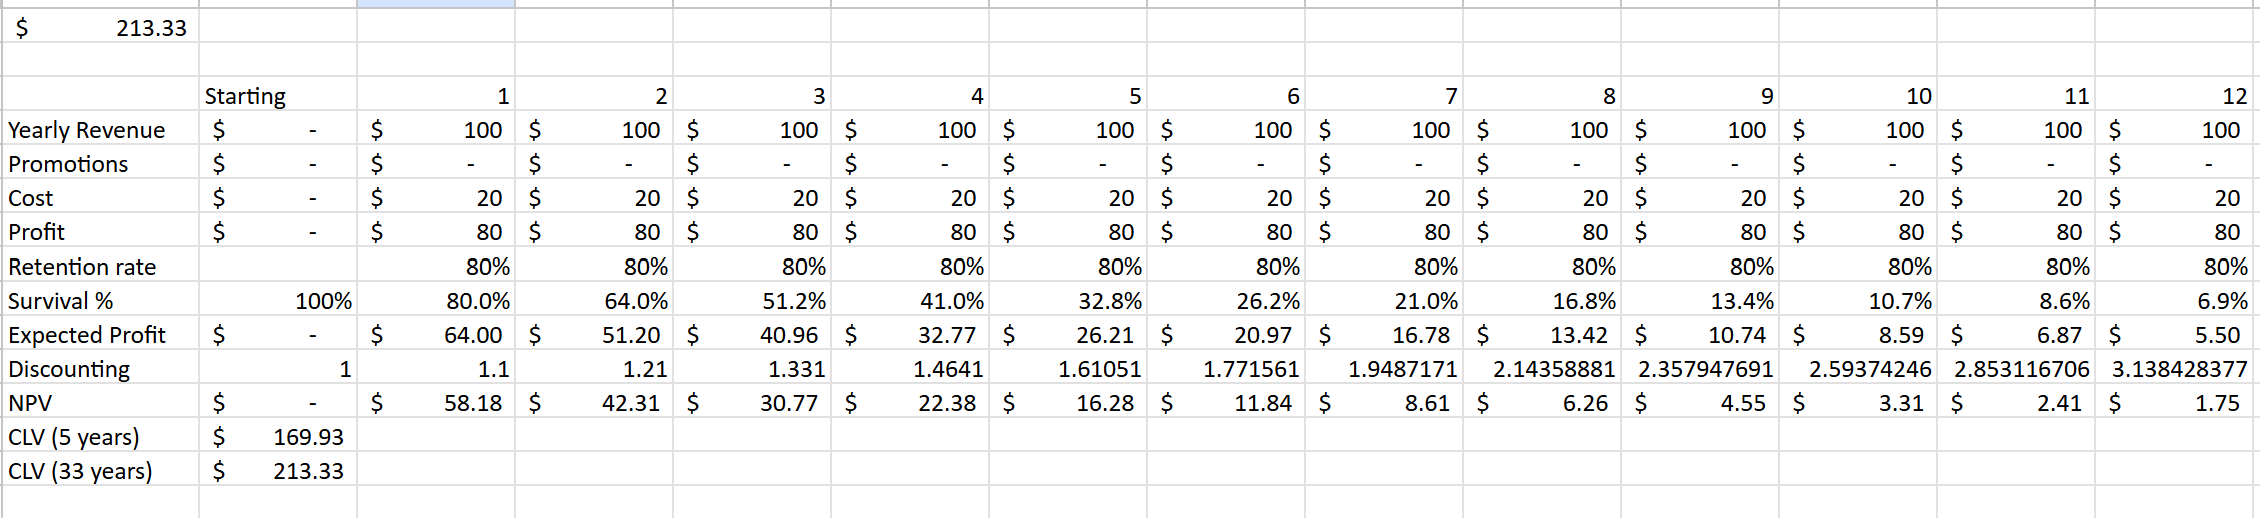
Customer Lifetime Value (CLV) is a core marketing metric used to estimate how much net profit a business can expect from a customer over the entire duration of their relationship. It’s important because it can help guide marketing budgets by serving as a max threshold for how much to spend on customer acquisition. In this project, I replicated two models—Cloud Service Storage and BHI—to explore how profitability changes over time with or without customer churn. Using Excel-based models, I calculated discounted profits using assumptions around revenue, costs, promotions, and retention.


To get familiar with the dataset, I used SQL queries to generate key summary statistics and uncover early patterns:
Average total spend: $208.32
Average number of books purchased: 3.89
Average recency (months since last purchase): 12.36
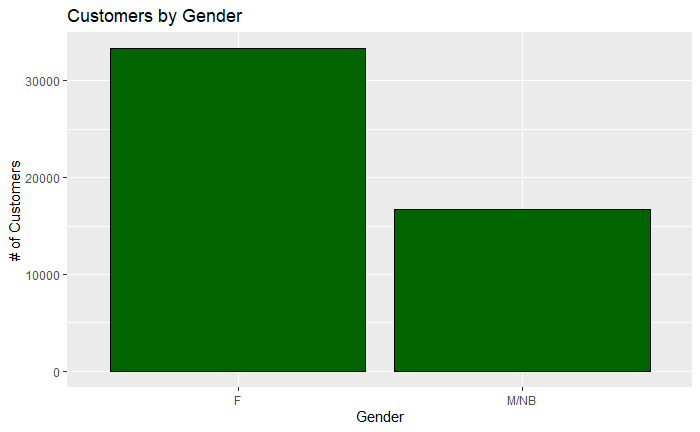
I also calculated subscription rates by gender: Female customers subscribed at a higher rate than male/NB customers. Overall, customers with more recent activity and higher spending were more likely to subscribe. I extended this analysis with deeper SQL insights into book category preferences, recency, and spending trends, comparing behaviors across subscribers and non-subscribers.
Linear Regression
Goal: Understand what drives overall spending.
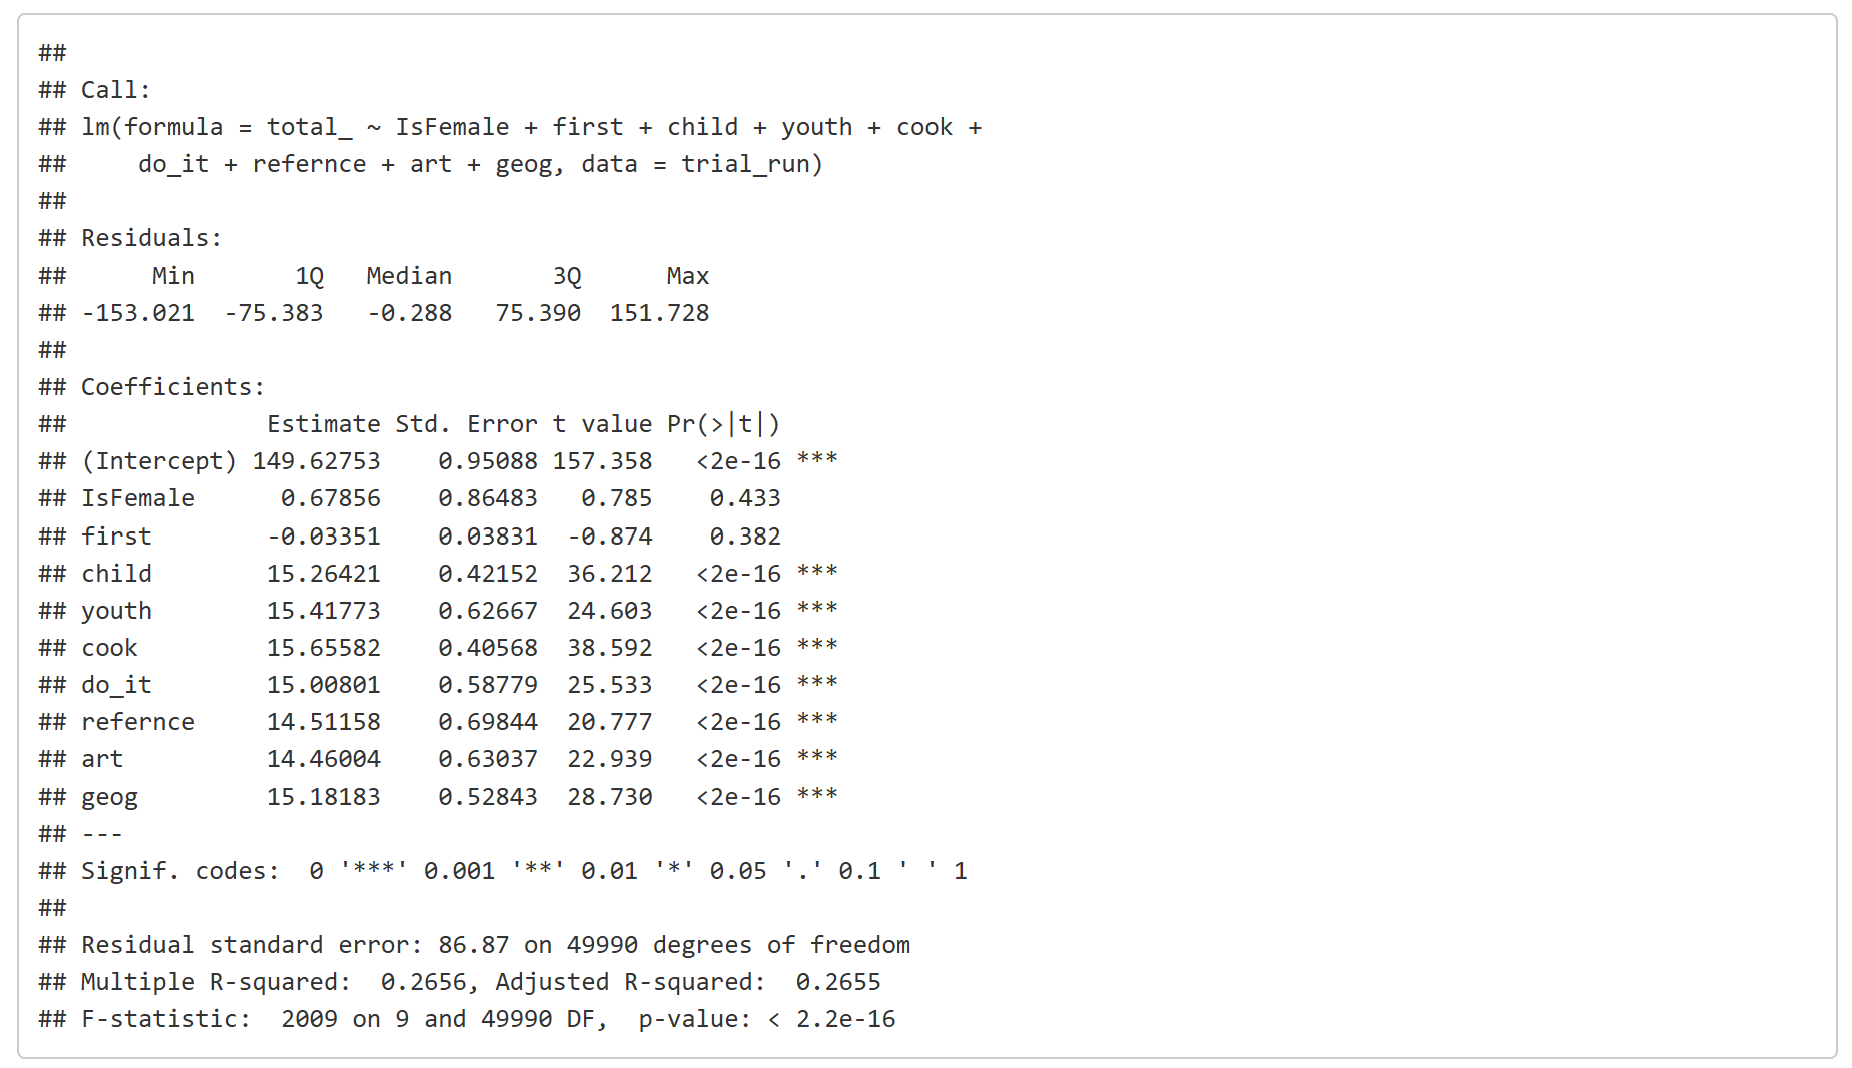
Result: I ran a linear regression model using gender, months since first purchase, and the number of books purchased across various categories. The model explained about 26.6% of the variation in total spend, which is a strong result for behavioral data. Interestingly, gender and account age were not statistically significant predictors of spending. Instead, the most impactful factors were the number of books purchased in each category—especially Young Adult, Cookbooks, DIY, and Travel. Each additional book purchased in these categories added approximately $14 to $16 to a customer’s total spend, with all category coefficients being highly statistically significant. These insights suggest that Florence Books can increase customer value by promoting popular categories and encouraging multi-category purchases.
Logistic Regression
Goal: Predict likelihood of online subscription.
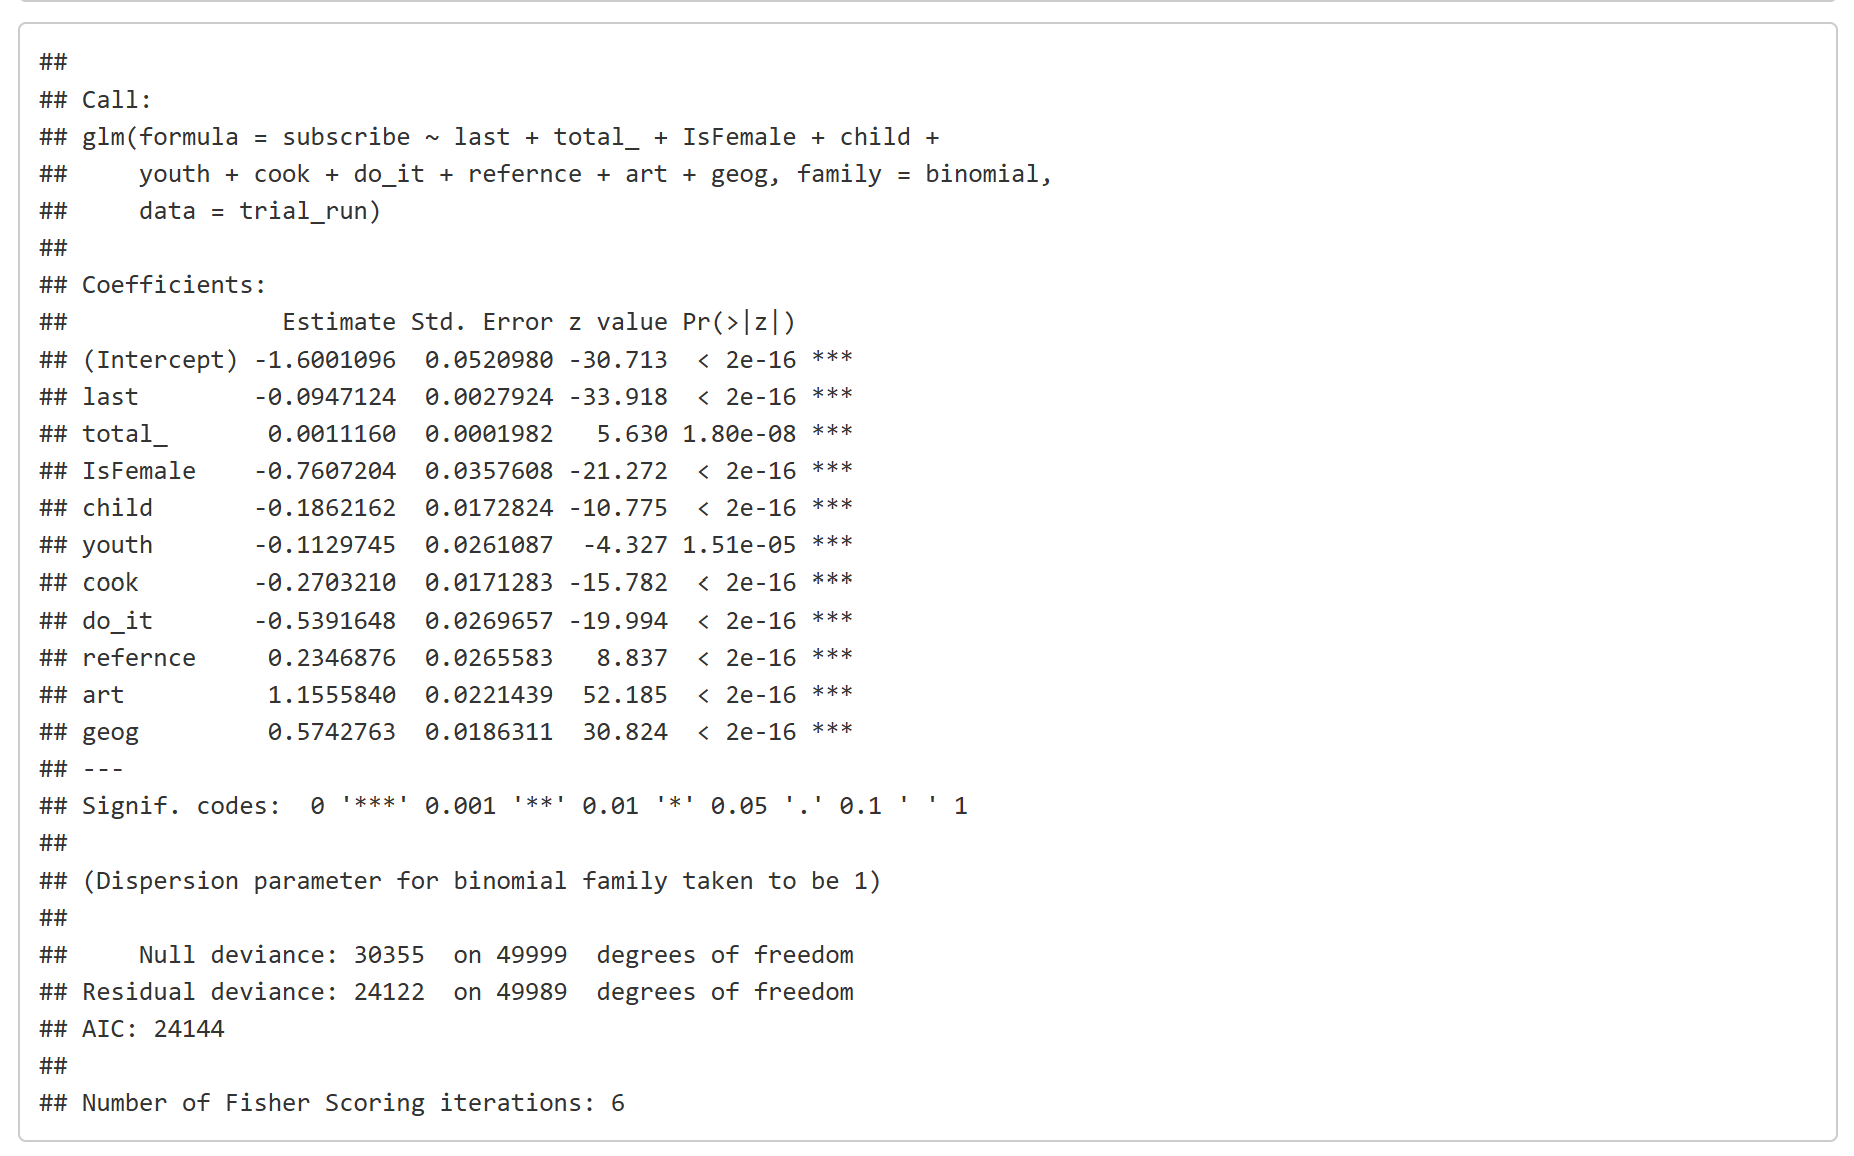
Result: To predict which customers were most likely to subscribe to the online book club, I built a logistic regression model using total offline spend, recency, gender, and book category behavior as predictors. Several variables were found to be statistically significant. Customers who made more recent purchases (lower last values) and spent more overall were more likely to subscribe. Interestingly, female customers were significantly less likely to subscribe than male/NB customers. Certain book categories were also strong predictors: purchases in art and geography/travel significantly increased the likelihood of subscribing, while purchases in cookbooks, DIY, children’s, and young adult categories were associated with a lower likelihood of subscription. These insights suggest that customers who explore niche or aesthetic categories like art and travel may be more interested in a curated book club experience, while those purchasing more utilitarian or family-oriented books may be less responsive. This segmentation can help Florence Books tailor messaging and campaign targeting to align with customer motivations and interests.
The model performed well and allowed me to assign a predicted subscription probability to each customer.
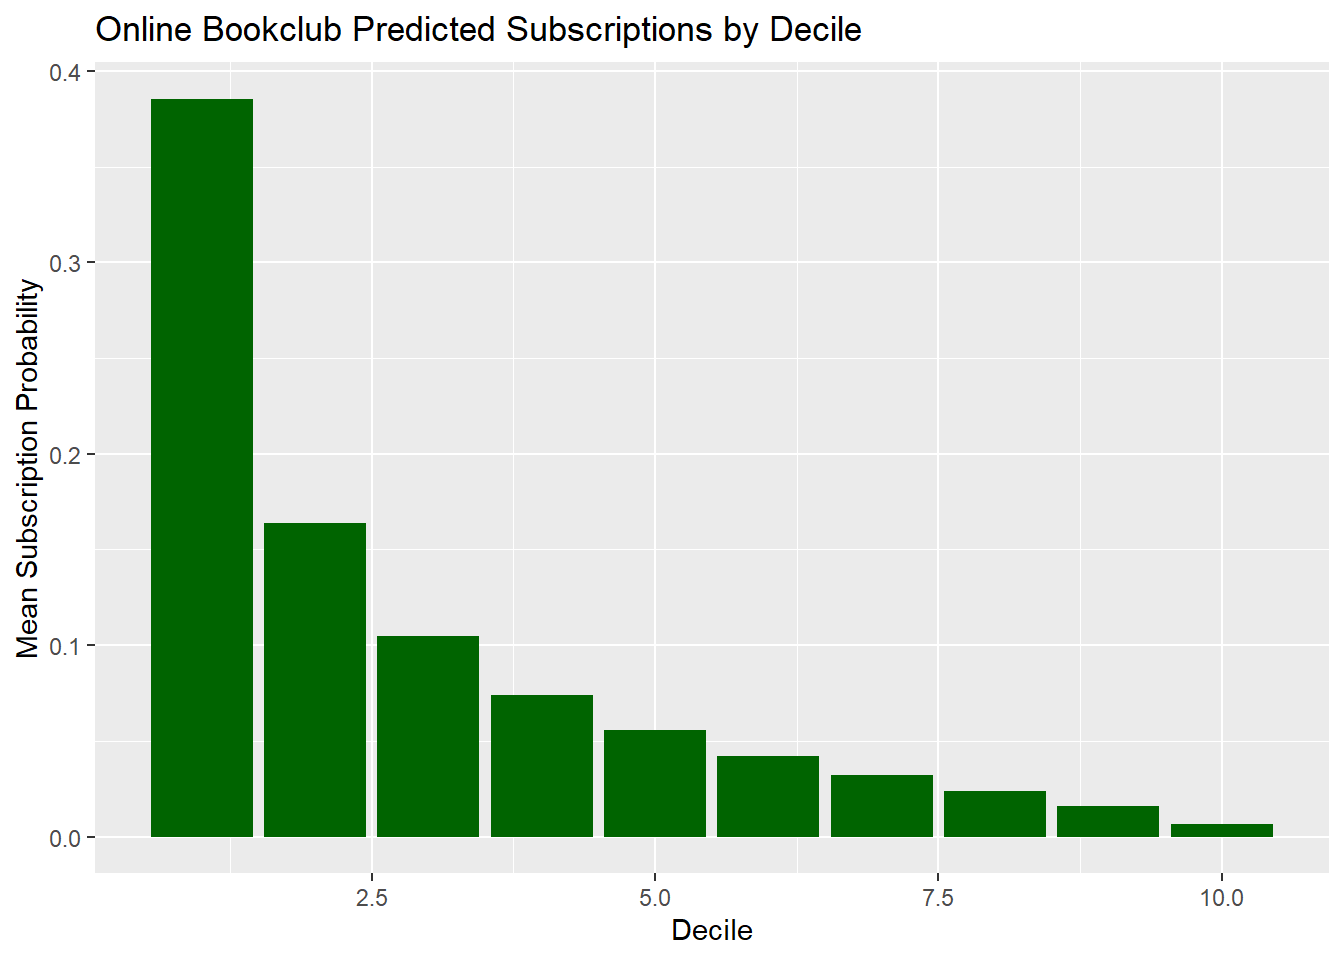
Using the logistic regression model’s predicted probabilities, I segmented customers into deciles:
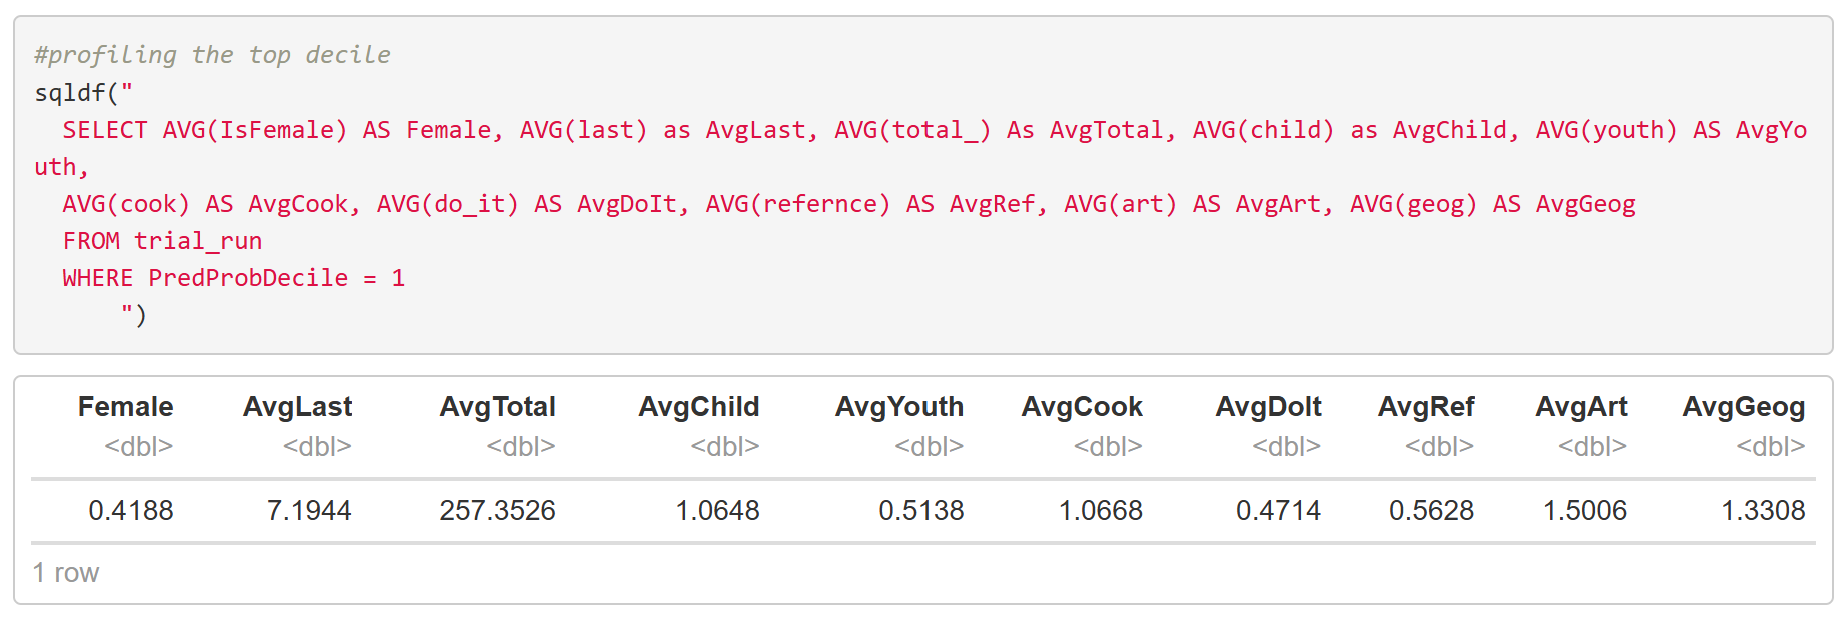
Top Decile: High predicted probability of subscribing
- Tend to shop more recently
- Spend more overall
- Purchase across multiple book categories
- Over-index on cookbooks and YA books
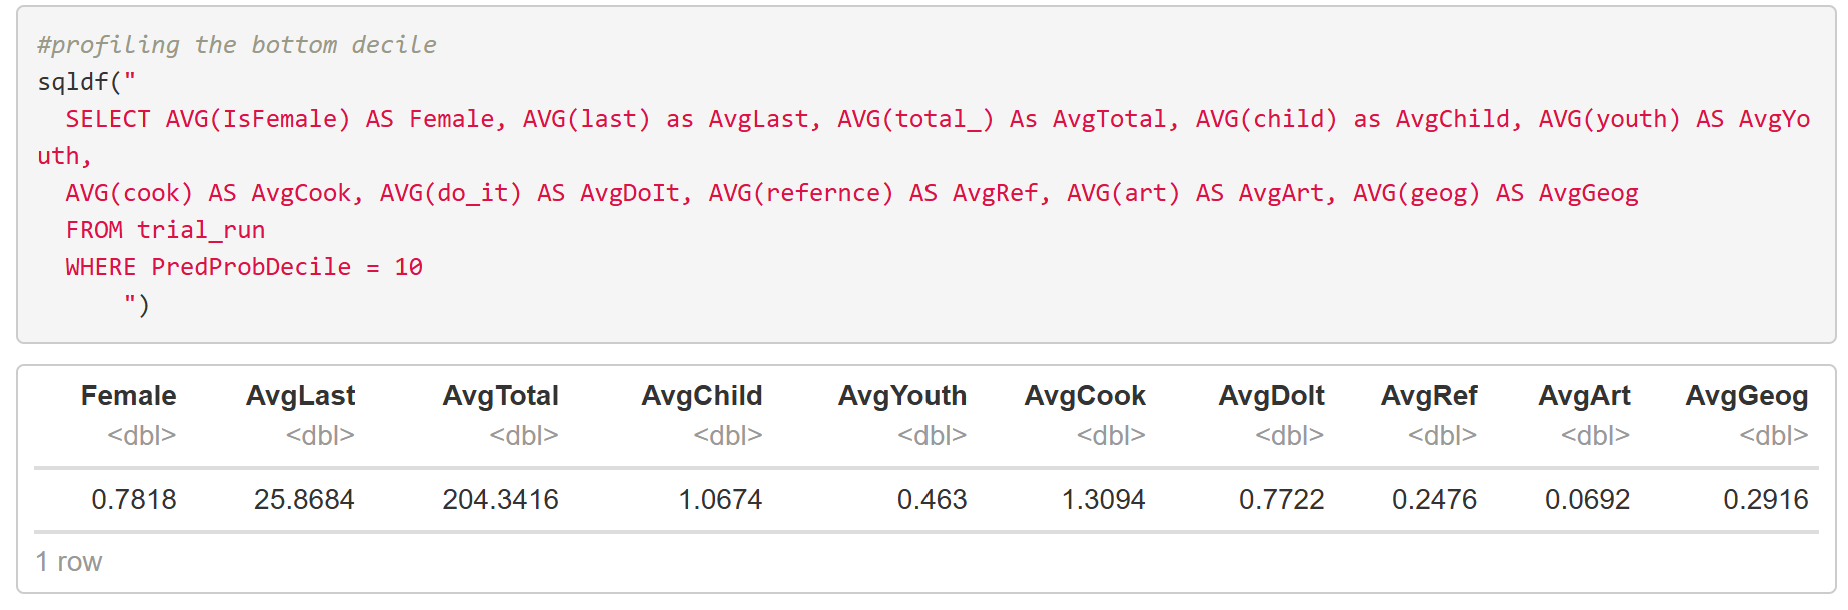
Bottom Decile: Low predicted probability
- Less recent engagement
- Lower spend
- Fewer book types purchased
These profiles helped define which customer segments were most likely to convert with targeted outreach. These insights suggest that promotional targeting should prioritize recent, high-value customers with demonstrated interest in trending or lifestyle-focused genres. Specifically, Florence Books should design campaigns that emphasize value and personalization for top-decile users, while potentially experimenting with re-engagement strategies—such as time-sensitive offers—for mid-tier segments rather than investing heavily in those least likely to convert.
Campaign Overview
Target Audience:
Customers with high predicted probabilities of subscribing — specifically those in the top decile of the logistic regression model. These customers tend to:Have made a recent purchaseSpend more than averagePurchase books in categories like Young Adult and CookbooksTiming:
Send the email within 7–10 days after a customer’s last offline purchase to take advantage of recent engagement and brand recall. This customer-firm relationship window is key to increasing conversion likelihood, especially while the customer is still in an active purchase mindset.
Email Design
Subject Line: “Your next favorite read is waiting…”
Message Content: Highlight exclusive benefits of the online book club (e.g., access to two curated e-books/month, themed picks)Personalize the message based on previous purchases (e.g., “You loved our cookbook selection—now discover monthly recipes hand-picked for you.”)Include a strong call-to-action (CTA): “Join Now”
Visuals: Show images of recent book selections. Feature clickable CTA buttons and genre-specific graphics
Marketing Metrics to Track
Open Rate – measure subject line effectiveness
Click-Through Rate – track engagement with the email content
Subscription Conversion Rate – primary success metric
Unsubscribe Rate – monitor for audience fatigue
Engagement Lag – time between email send and conversion
A/B Test Proposal
Test Variable: Subject Line
A“Your next favorite read is waiting…”
B“Get 2 free e-books this month — just for you”
Hypothesis: The incentive-based subject line in Group B will result in a higher open rate and potentially more conversions, while the curiosity-based line in Group A may attract more qualified clicks.
Objective
Increase faculty engagement and invention disclosures by identifying which outreach methods and communication strategies are most effective.
Key Questions
- Which outreach channels (email, workshops, 1:1 meetings) lead to the most invention disclosures?
- What characteristics (e.g., department, seniority, prior engagement) predict higher faculty involvement?
- How can we segment and tailor communications to increase response and participation?
Data Needs
Types of Data
- Faculty directory: name, department, title, research area
- Invention disclosure records: submission dates, technology domains, faculty involved
- Outreach logs: dates, event types, participation
- Email marketing performance: open rates, click-through rates, bounce ratesSample Datasets- faculty.csv: faculty_id, name, department, title- disclosures.csv: disclosure_id, faculty_id, submission_date, tech_area- outreach.csv: event_id, event_type, date, participants- emails.csv: faculty_id, email_subject, open_rate, click_rateData RelationshipsDatasets are linked via faculty_id. Time-stamps can be used to measure the lag between outreach and disclosure.Potential Data Issues- Missing or inconsistent participant data in outreach logs- Duplicate or outdated contact information- Bias from only tracking active inventors or frequent participants
Data Cleaning and Processing
- Standardize faculty IDs and ensure consistent naming across datasets
- Transform date fields into derived metrics (e.g., recency of interaction)
- Group event types into high-level categories for analysis
- Normalize email engagement scores
- Flag first-time inventors versus returning participantsPlanned
Analyses
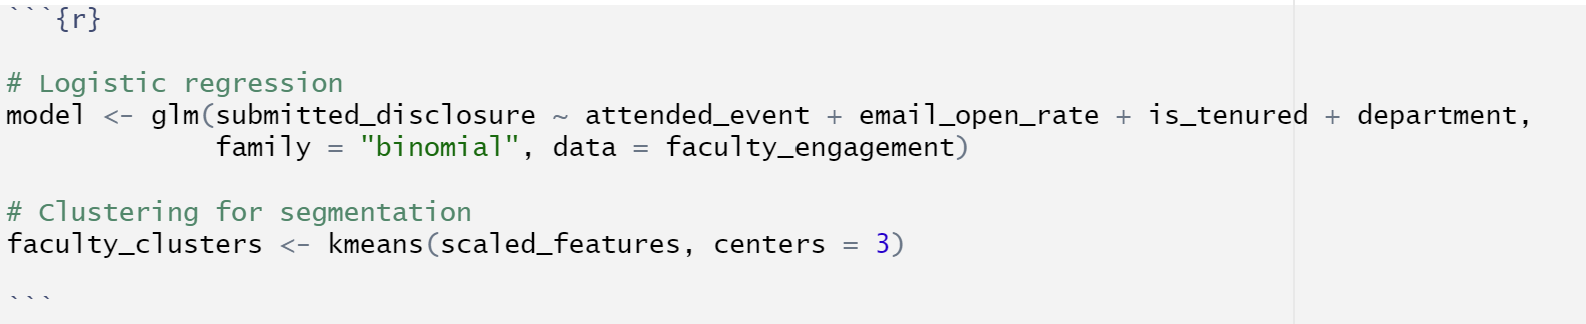
- Logistic regression to predict likelihood of a disclosure
- Clustering to segment faculty based on behavioral and demographic traits
- Time-series analysis to identify lag between outreach and engagement
Hypotheses
- Faculty who attend personalized 1:1 meetings are more likely to submit a disclosure within 30 days
- Early-career faculty are more responsive to targeted outreach than tenured faculty
- In-person workshops lead to higher conversion rates than email aloneSample Visualizations
- Engagement funnel: email → event → disclosure
- Heatmaps showing outreach effectiveness by department
- Timeline overlays showing spikes in disclosures after events
Anticipated Insights
Identification of high-value faculty segments for personalized outreach- Best-performing outreach methods by segment and department- Optimal frequency and timing of communications
Example Pseudo-Code in R
Strategic Integration
- Develop engagement scoring to prioritize faculty follow-ups
- Segment and personalize email content based on past behavior and department
- Use model outputs to inform when and how to contact faculty
Repeatability
- Refresh models and segments on a quarterly basis
- Establish dashboards to track performance in real-time
Key Metrics to Track
- Disclosure submission rate by campaign or outreach type
- Engagement score distribution across departments
- Conversion lag time (from outreach to disclosure)
Follow-Up Analytics
- Cluster faculty into personas for long-term engagement strategies
- Perform sentiment analysis on survey and feedback data
- Track disclosure-to-license lifecycle metrics for deeper impact analysis
Building a Data-Informed Culture
- Develop internal dashboards for team-wide visibility
- Create templates and playbooks for A/B testing outreach approaches
- Host regular review sessions to share findings and refine strategy
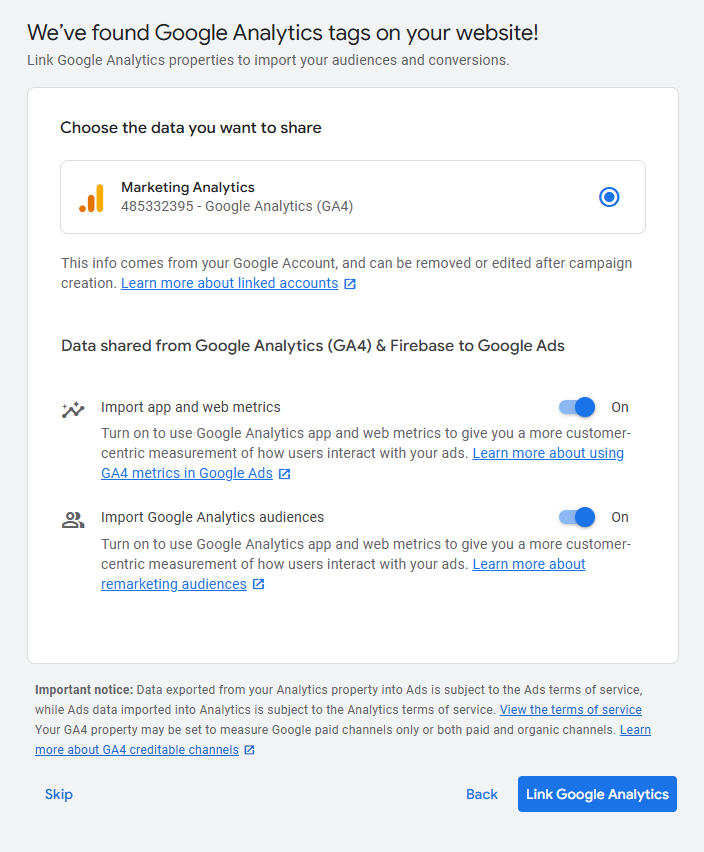
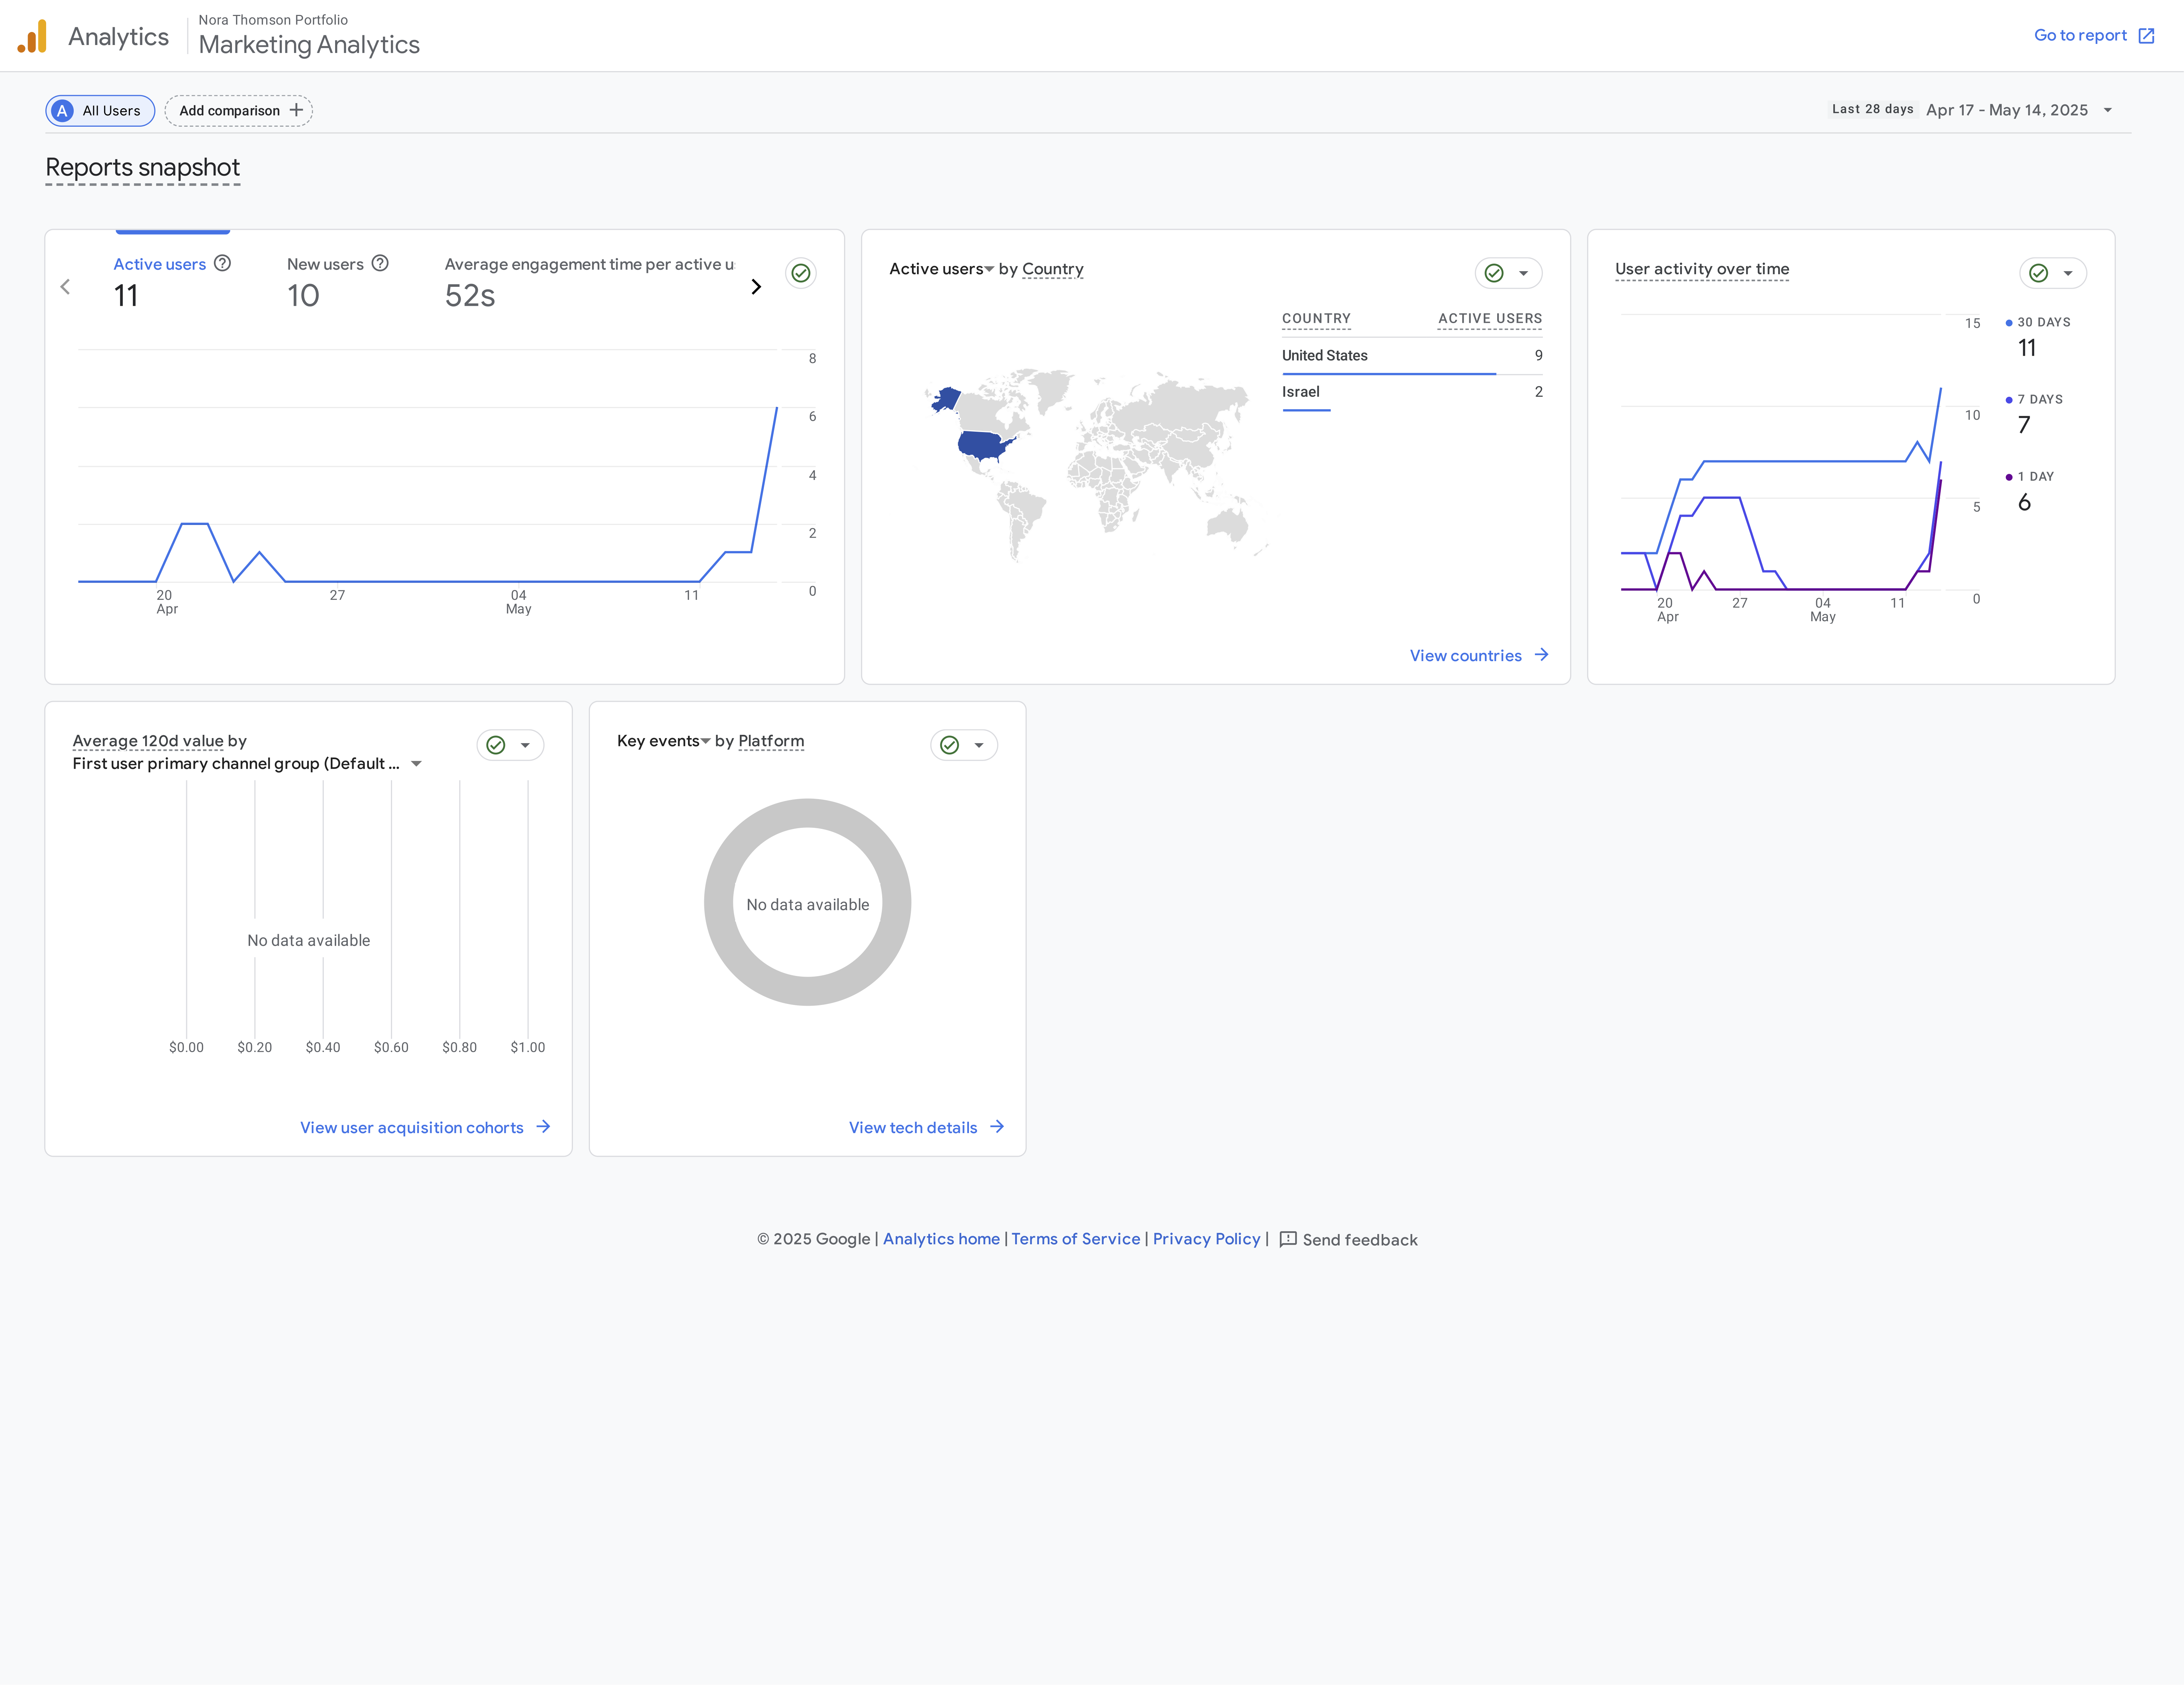
To better understand how users interact with my personal portfolio site, I integrated Google Analytics 4 and monitored key metrics over a 28-day period (April 17 – May 14, 2025).
Active Users (28 days): 11
New Users: 10
Average Engagement Time: 52 seconds per user
Top Locations: United States – 9 users, Israel – 2 users
Interpretation:The majority of my traffic is coming from the U.S., likely due to personal outreach, networking, and direct sharing of the site link. There is some international reach, which may reflect portfolio viewers from professional platforms or past collaborations.An average engagement time of nearly one minute indicates visitors are spending meaningful time exploring my portfolio — especially considering this is an early-stage site without active traffic-driving campaigns yet.
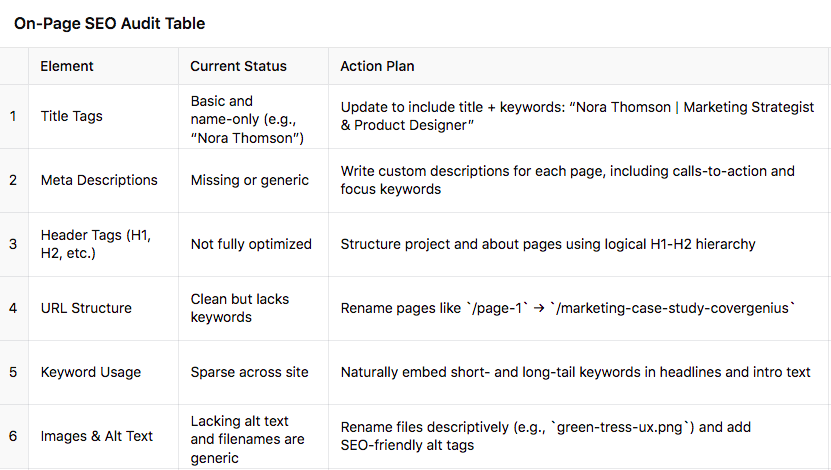
Improving search engine visibility is critical for attracting organic traffic and positioning myself as a strategic marketer and designer. This SEO audit covers keyword strategy, on-page factors, content evaluation, and link planning.
Keyword Strategy
I conducted keyword research using Ubersuggest and Google Keyword Planner to identify relevant search terms based on my expertise and audience.
Short-Tail Keywords
- marketing strategist
- product designer
- portfolio site
- Webflow portfolio
Long-Tail Keywords
- creative marketing strategist portfolio
- Lehigh University marketing analytics student
- digital marketing and product design case studies
- portfolio of a marketing strategist
- design thinking background
These keywords align with my target audience: hiring managers, recruiters, and creative industry professionals looking for early-career marketing talent with a hybrid background.
Target Audience:
Recruiters, hiring managers, DTC/CPG companies, and innovation-focused employers
Current Strengths:
Clean, well-organized layoutClear articulation of your cross-functional skillsUse of visual storytelling
Opportunities for Improvement:
Expand case studies with specific outcomes, metrics, and your roleAdd a blog or insights page for thought leadership and recurring contentInclude clear CTAs, like “Download Resume” or “Let’s Connect”
Current Links:
Minimal external links and no backlinks identified yet
Ideal Backlinks To Target:
- Lehigh University (student/alumni features, entrepreneurship program)
- Medium or LinkedIn articles you’ve written
- Design communities (e.g., Behance, Dribbble, Women Who Design)
- Collaborator websites (if they feature your work)
Tool Used:
Ahrefs Free Backlink CheckerWhat to Avoid:
Spammy directories or bulk link servicesNon-relevant, low-quality blogs
As part of my broader digital presence plan, I developed a concept for an email newsletter that aligns with my personal brand, showcases my work, and provides value to a professional audience.
Newsletter Concept: The Creative Edge
Objective:
To build relationships with potential collaborators, recruiters, and peers by sharing curated updates, insights, and creative inspiration related to marketing, design, and innovation.
Each edition would include:
1) Project Spotlight: A deep dive into a recent portfolio update or case study (e.g., Green Tress, Foli-Q, or Cover Genius)
2) Behind-the-Scenes Insight: Lessons learned or tools used in my process
3) Trends & Inspiration: A roundup of industry articles, tools, or creative ideas I’m exploring
4) Upcoming Goals or Blog Posts: A preview of what’s coming next
Email Marketing Metrics:
Open Rate – % of recipients who open the email
Click-Through Rate (CTR) – % of recipients who click on a link
Unsubscribe Rate – % of recipients who opt out
Bounce Rate – % of emails that failed to deliver
Google Analytics Metrics
Sessions Originating from Email
Pages Per Session – How much content users explore after clicking
Session Duration
Goal Completions – e.g., clicks on "Download Resume" or form submissions
A/B Testing Plan
Subject lines are a major driver of engagement. This A/B test explores whether my audience prefers a more formal tone or a more vibrant, personality-driven one.
Rationale:
Version A communicates exactly what the recipient will learn by opening the email — it’s project-specific and results-oriented.
Version B emphasizes personality and creativity, tapping into curiosity and relatability.
This A/B test explores whether my audience is more drawn to clarity and specificity or emotion and intrigue — helping shape the tone of future outreach and portfolio communications.
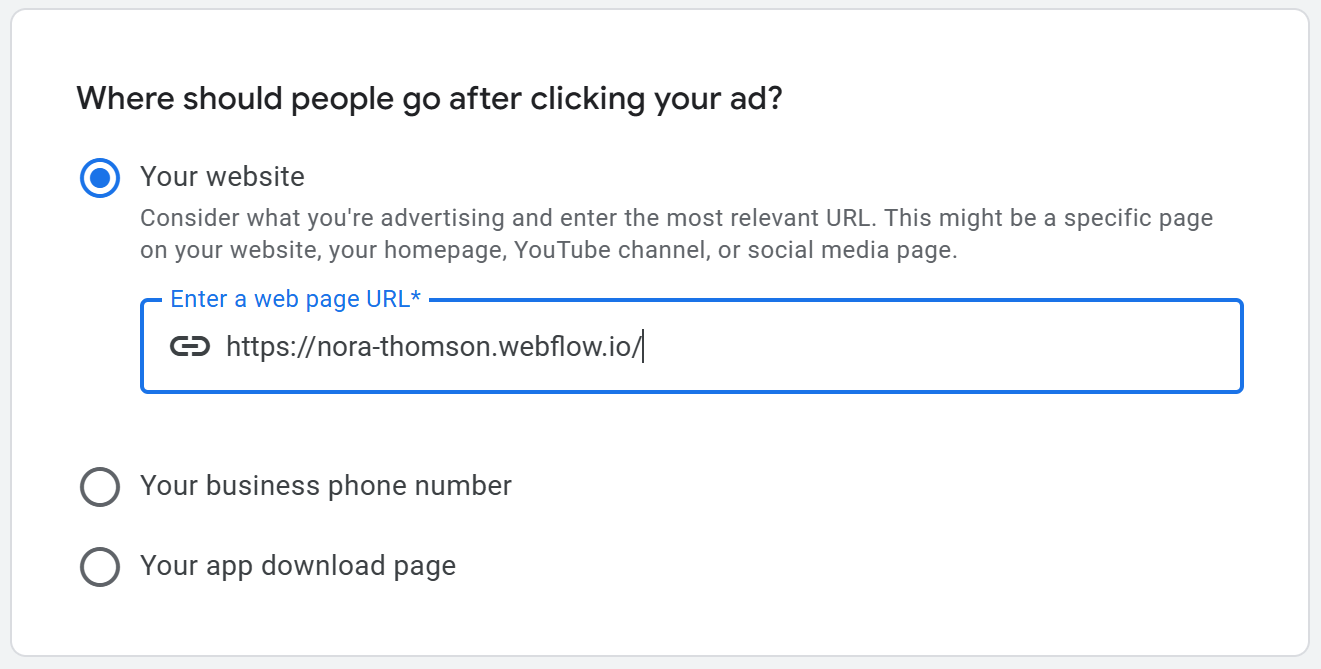
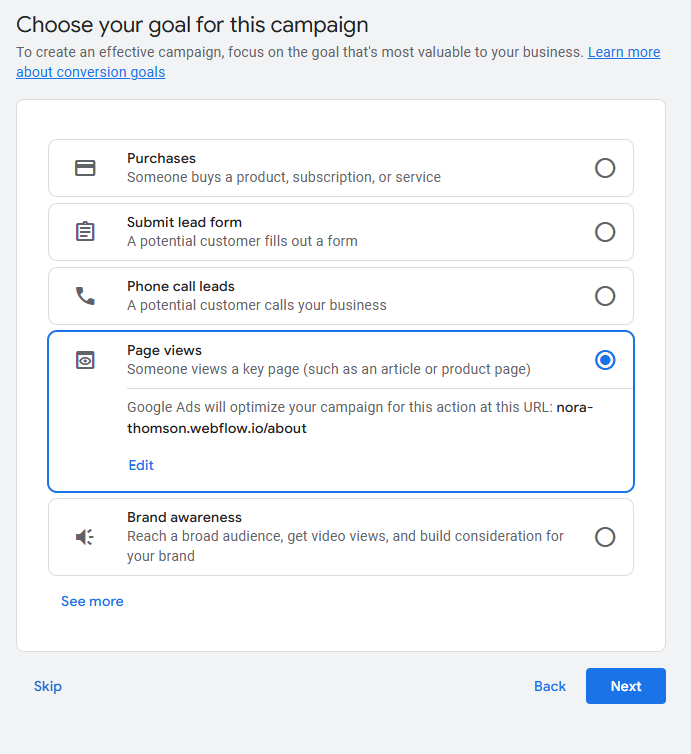
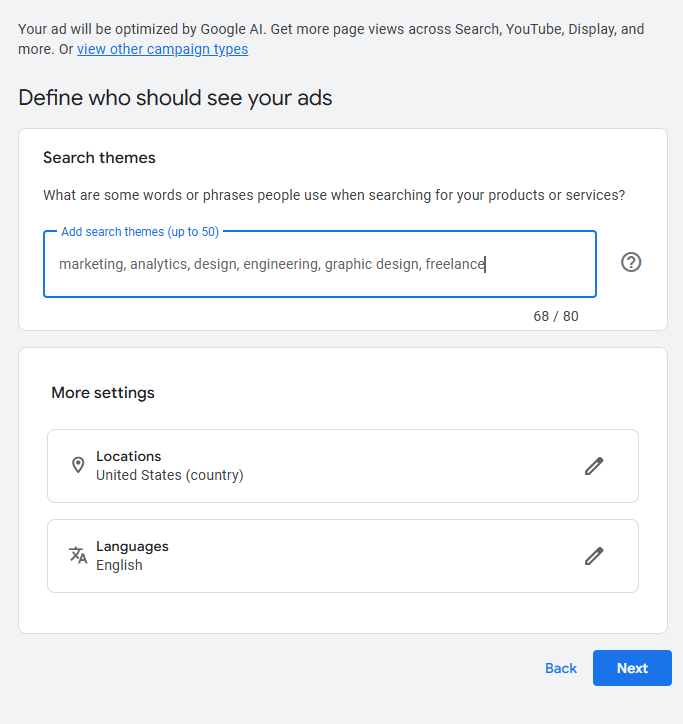
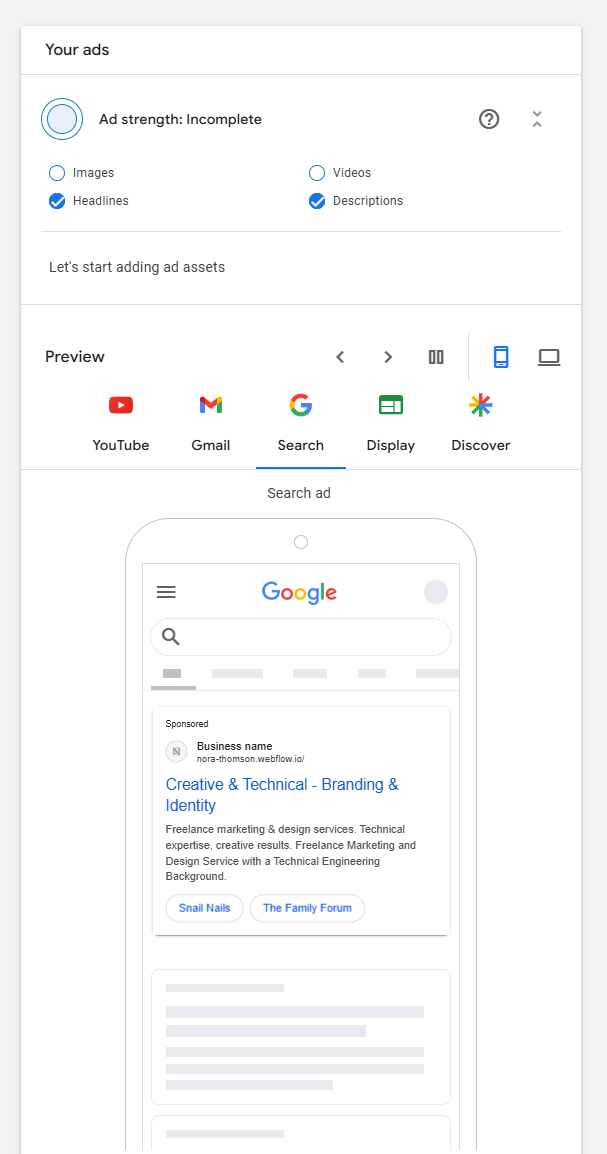
To understand how paid media could enhance visibility for my portfolio, I simulated the setup of a Google Ads Search Campaign to promote to prospective employers and collaborators.
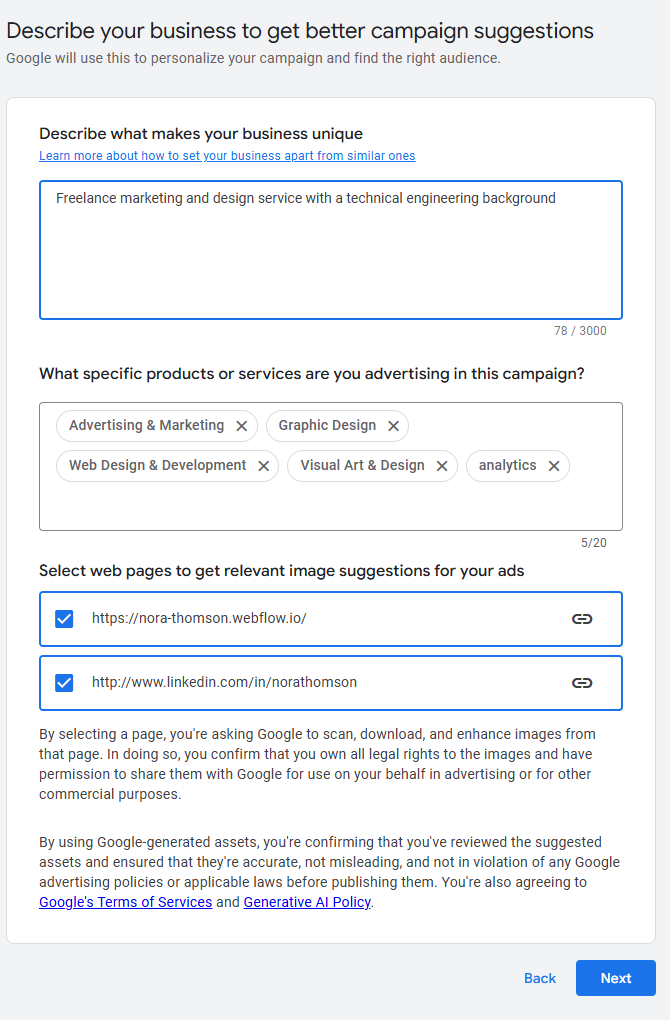
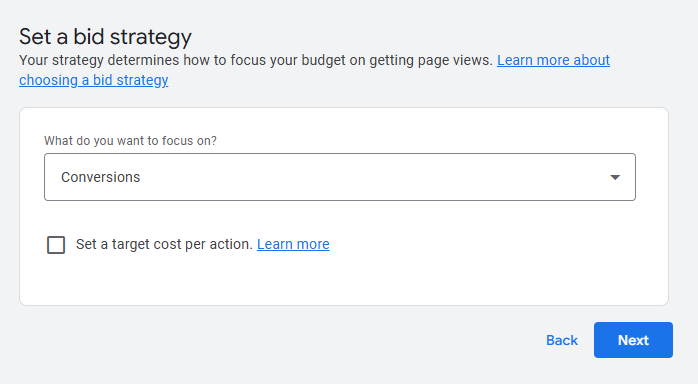
Campaign Objective
Promote my portfolio to users searching for creative marketing talent, portfolio examples, or early-career strategists in marketing, product, and brand development. I chose keywords that align with how employers or recruiters might search for someone with my skills, background, and career focus.
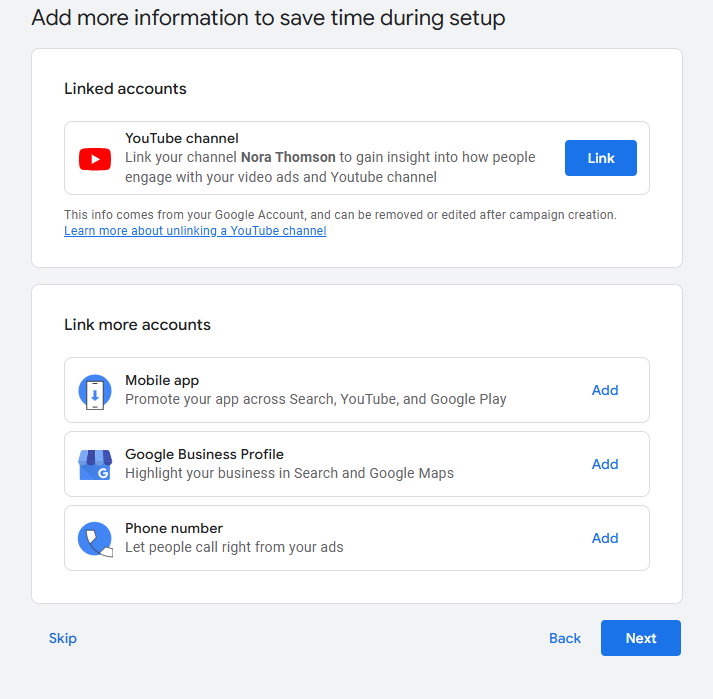
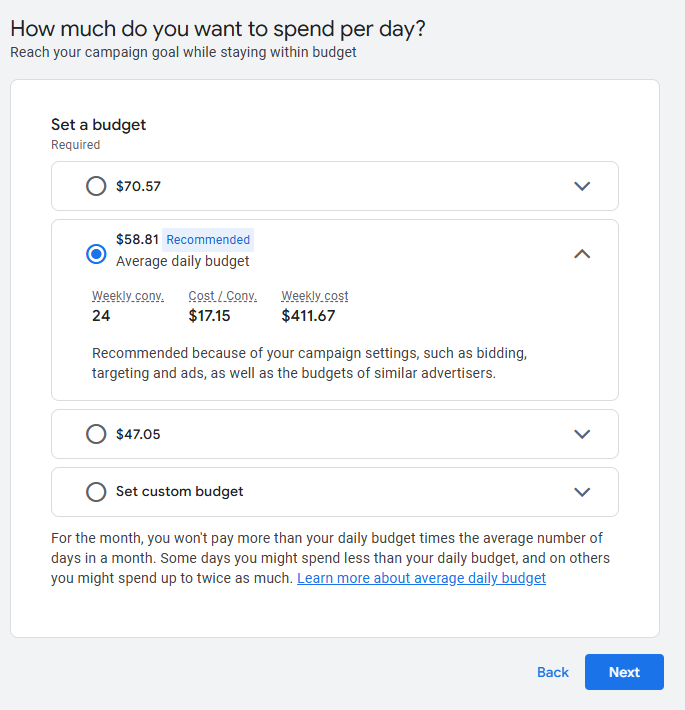
Campaign Setup Walkthrough
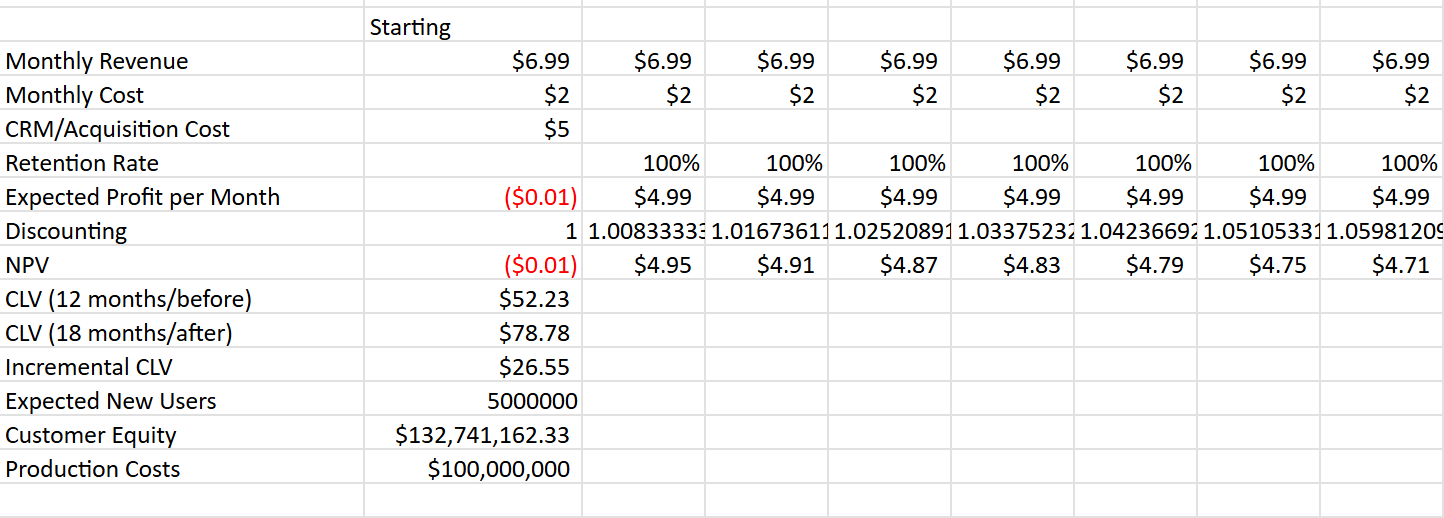
This portion of the project applied Customer Lifetime Value (CLV) modeling to evaluate whether the high production cost of a streaming series is justified by its impact on customer equity. I selected “The Mandalorian” on Disney+ as a case study due to its large cultural footprint, production investment, and role in driving early subscriber growth for the platform.To evaluate whether The Mandalorian justified its estimated $100 million production cost, I modeled the change in Customer Lifetime Value (CLV) resulting from the show's release. The first season's budget was reported to be around $100 million, averaging approximatiely $12.5 million per episode. At launch, Disney+ was priced at $6.99 per month . I estimated the monthly cost to serve a user at $2, accounting for content delivery and platform maintenance. Assuming The Mandalorian extended the average customer lifetime from 12 to 18 months, reflecting its role in enhancing engagement and reducing churn, and applying a standard $5 per user for acquisition and CRM costs, I calculated the resulting increase in customer equity. Notably, Disney+ amassed 28.6 million subscribers within three months of its launch, a growth significantly driven by The Mandalorian . Using a conservative estimate of 5 million new users attributable to the show, the analysis suggests that high-production-value content can drive substantial platform growth and profitability.To estimate the financial value of The Mandalorian, I modeled customer lifetime value (CLV) over two scenarios: one where a customer stays subscribed for 12 months (baseline), and another where retention extends to 18 months as a result of the show’s impact. I assumed a monthly profit of $4.99 per user (after subtracting a $2 cost from the $6.99 subscription price), and discounted each month’s profit using a 10% annual discount rate (0.00833 monthly) to reflect the time value of money.Each month’s profit was divided by a growing discount factor (1 + r)^{t-1}, where ttt is the number of months since sign-up. The discounted profits were then summed to calculate the present value of customer profit over 12 and 18 months. A one-time $5 acquisition cost was subtracted from each total to get the final CLV.
CLV (12-month scenario): $52.23
CLV (18-month scenario): $78.78
Increase in CLV per customer: $26.55
This difference quantifies the additional value each customer brings due to extended retention. To estimate total customer equity generated by the show, I multiplied this incremental CLV by a conservative estimate of 5 million new subscribers: $26.55 × $5,000,000=$132.75 million.
This figure significantly exceeds the estimated $100 million production cost of The Mandalorian, supporting the idea that the show was a strategically valuable investment for Disney+.
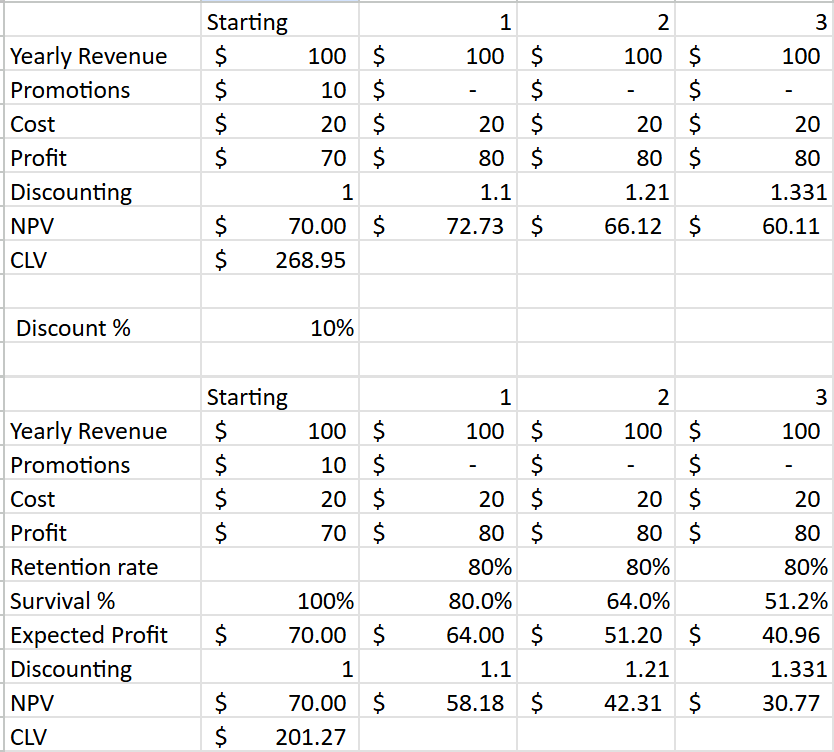
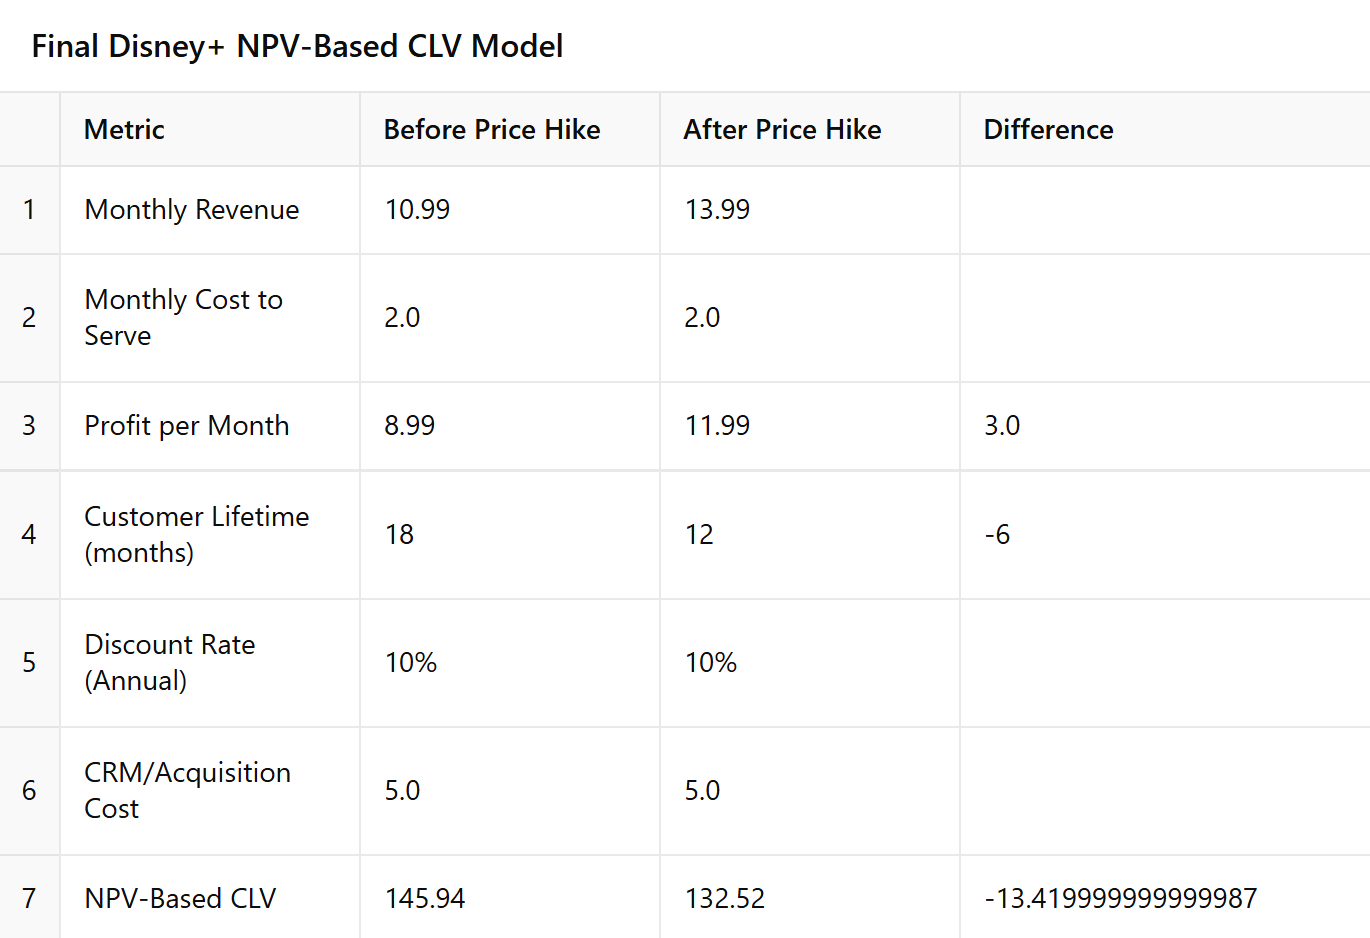
This section evaluates how subscription price increases affect Customer Lifetime Value (CLV), using Disney+ as a case study. While higher prices may boost short-term revenue, they also risk reducing customer retention — a key driver of long-term profitability. I used a Net Present Value (NPV) approach to determine whether Disney+’s pricing strategy ultimately increased or eroded customer equity.
Disney+ originally priced its monthly subscription at $10.99. Following a series of content expansions and platform changes, the price was raised to $13.99. At the same time, growing frustration with password-sharing crackdowns and additional ad tiers led to signs of reduced user retention. To analyze this shift, I modeled CLV using the NPV method with a 10% annual discount rate, keeping acquisition cost and cost to serve constant. The model compared two scenarios:
Before the price hike: 18-month average customer lifetime
After the price hike: 12-month average customer lifetime
Despite a significant increase in monthly profit, the reduction in customer lifetime resulted in a CLV decline of $13.42. This demonstrates that the benefits of higher prices were partially offset by the cost of lower retention. This analysis illustrates a core principle in CLV modeling: retention is often more impactful than pricing. While Disney+ increased revenue per user, the shorter average subscription span brought total customer value down. The decline from $145.94 to $132.52 in NPV-based CLV reinforces the importance of balancing pricing strategies with user experience and long-term engagement.
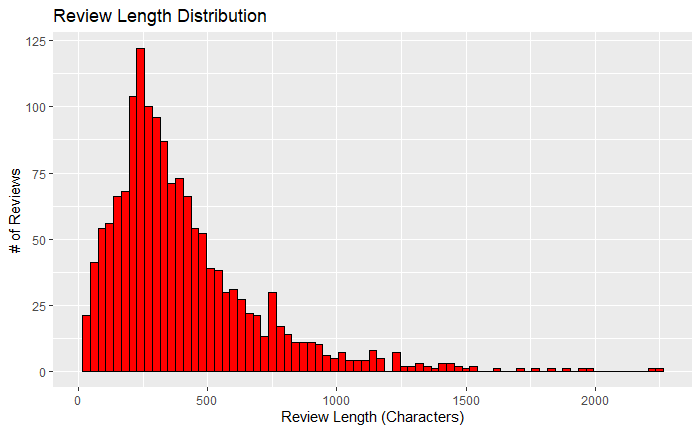
To explore the relationship between review length and sentiment, I began by calculating the number of characters in each review and plotted a histogram to visualize the distribution. I determined that reviews falling below the 25th percentile in length could be classified as "short," while those above the 75th percentile were considered "long." I then applied VADER sentiment analysis to each review to assign a compound sentiment score between -1 (most negative) and 1 (most positive).
Welch Two Sample t-test
data: short_one_star$Compound and long_one_star$Compound
t = -2.3457, df = 38.454, p-value = 0.02424
alternative hypothesis: true difference in means is not equal to 0
95 percent confidence interval:
-0.5905206 -0.0435350
sample estimates:
mean of x mean of y
0.1041791 0.4212069
I compared the sentiment of short and long 1-star reviews to determine whether review length influences emotional tone. The average sentiment score of long 1-star reviews was significantly lower than that of short ones, indicating more intense negativity in detailed complaints. A Welch two-sample t-test confirmed that this difference was statistically significant (p = 0.024), suggesting that longer negative reviews tend to be more emotionally charged and offer deeper insights into customer dissatisfaction.
Welch Two Sample t-test
data: short_five_star$Compound and long_five_star$Compound
t = -9.0021, df = 376.26, p-value < 2.2e-16
alternative hypothesis: true difference in means is not equal to 0
95 percent confidence interval:
-0.3178018 -0.2038580
sample estimates:
mean of x mean of y
0.6087085 0.8695385
Then I did the same for short and long 5-star reviews. The results revealed a clear difference: longer 5-star reviews had significantly higher sentiment scores on average (0.87) compared to shorter ones (0.61). This indicates that more detailed positive reviews tend to express a stronger emotional tone, often reflecting a deeper level of customer satisfaction. A Welch two-sample t-test confirmed that the difference was highly statistically significant (p < 2.2e-16). This supports the idea that long-form customer feedback can offer richer insights into what users genuinely love about a product.
.png)
.png)
As a final comparison, I evaluated whether sentiment scores from VADER aligned with the numerical star ratings themselves. On average, 5-star reviews had a compound sentiment score of 0.76, while 1-star reviews averaged just 0.18. This large difference in tone confirms that VADER sentiment analysis tracks well with customer satisfaction levels. A Welch two-sample t-test showed this difference to be highly statistically significant (p< 2.2e-16), with a 95% confidence interval of [0.494, 0.670]. This result validates the use of text-based sentiment analysis as a reliable complement to star ratings when evaluating overall brand perception.
Welch Two Sample t-test
data: reviews_vader[reviews_vader$rating == 5, ]$Compound and reviews_vader[reviews_vader$rating == 1, ]$Compound
t = 13.028, df = 187.67, p-value < 2.2e-16
alternative hypothesis: true difference in means is not equal to 0
95 percent confidence interval:
0.4941456 0.6704875
sample estimates:
mean of x mean of y
0.7584542 0.1761377
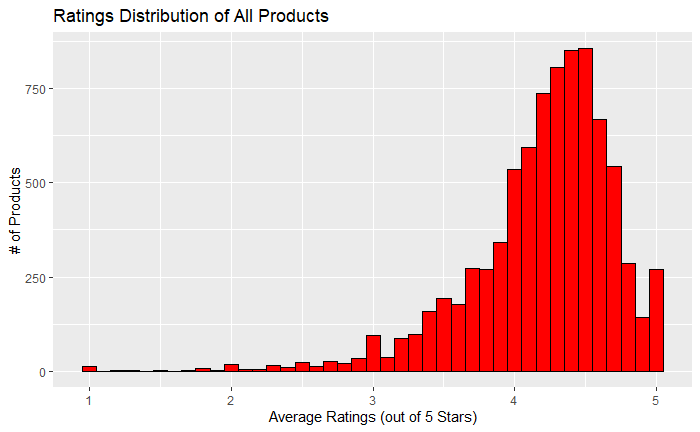
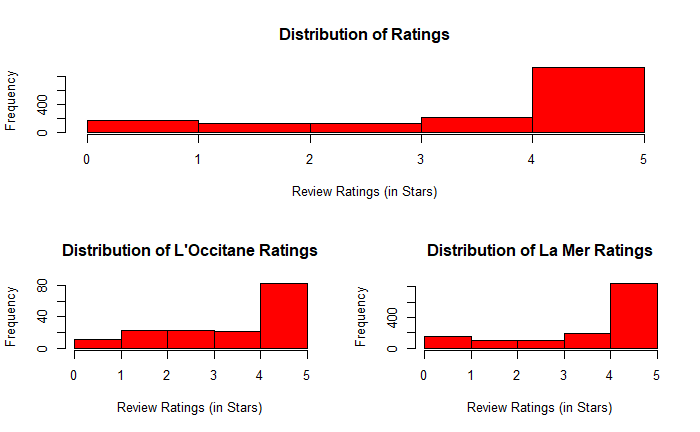
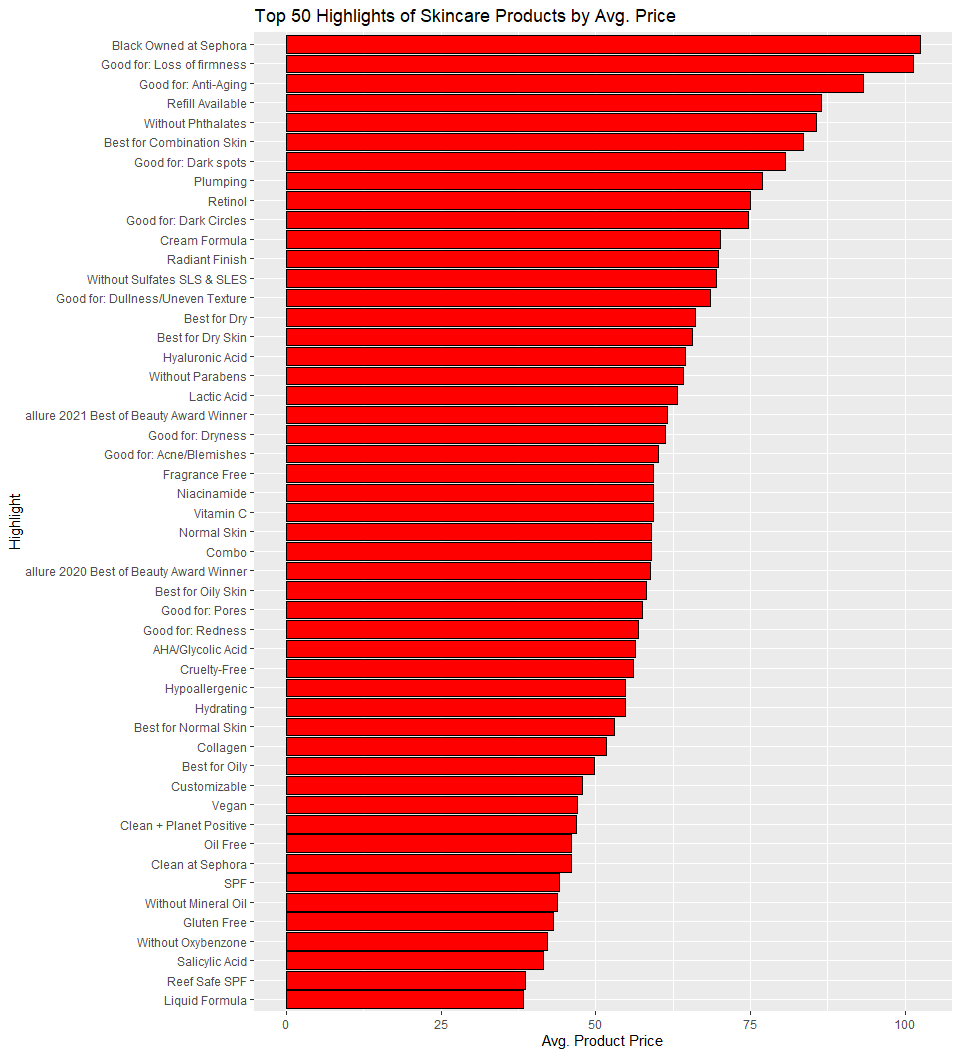
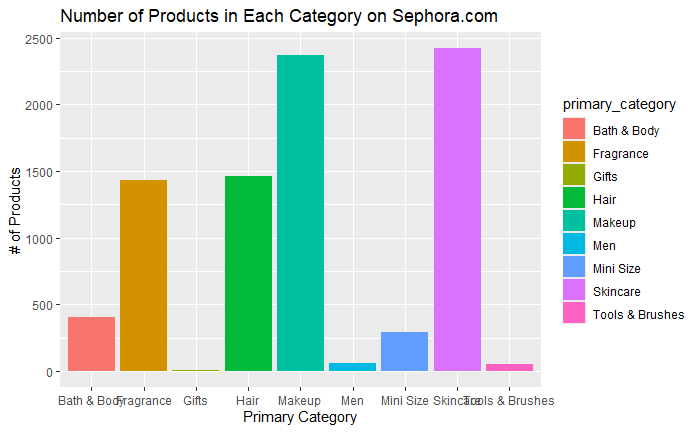
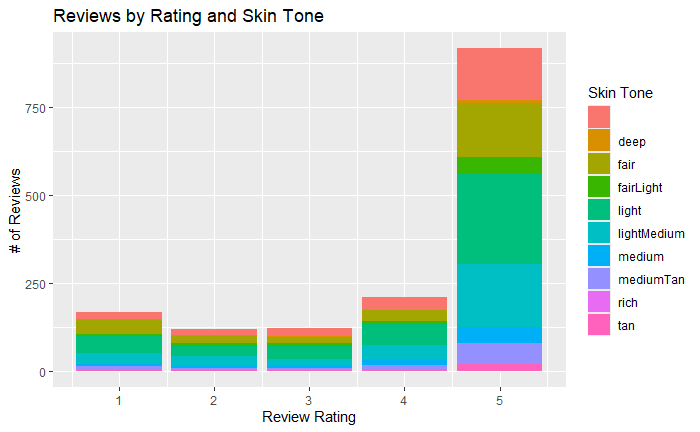
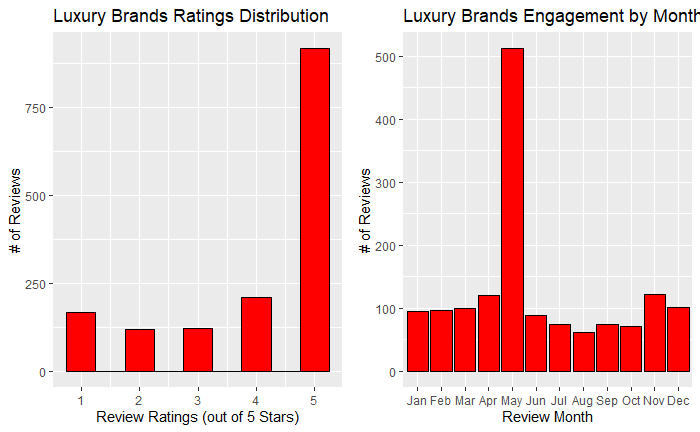
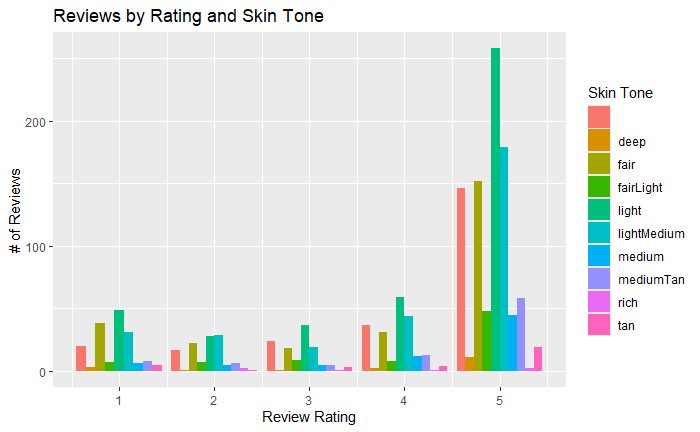
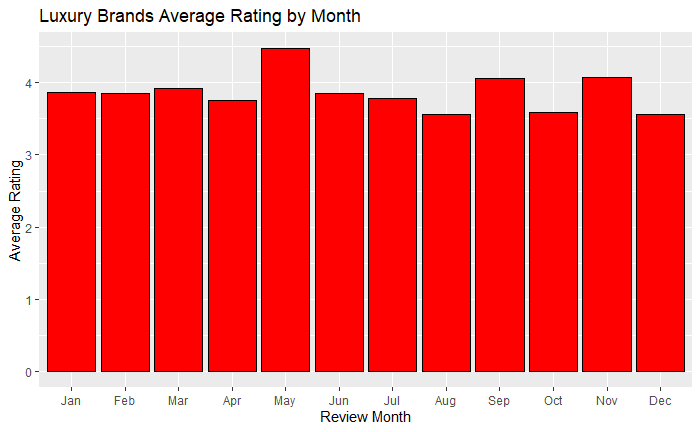
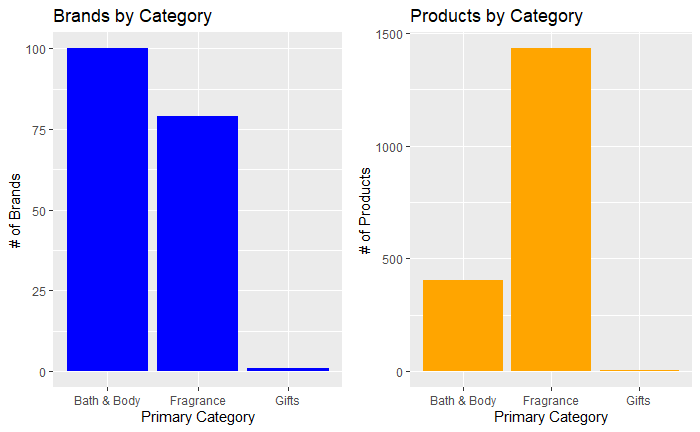
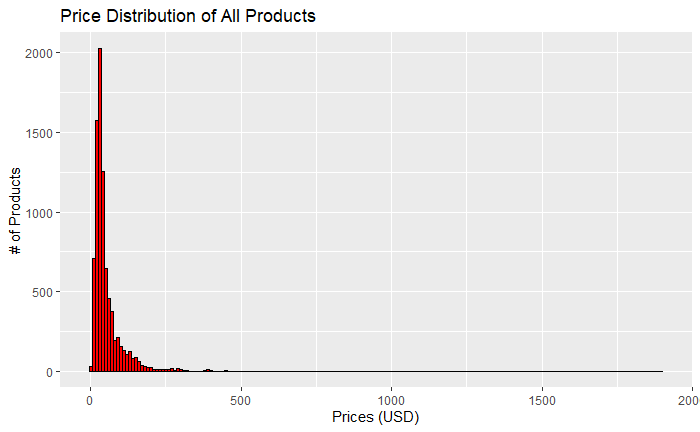
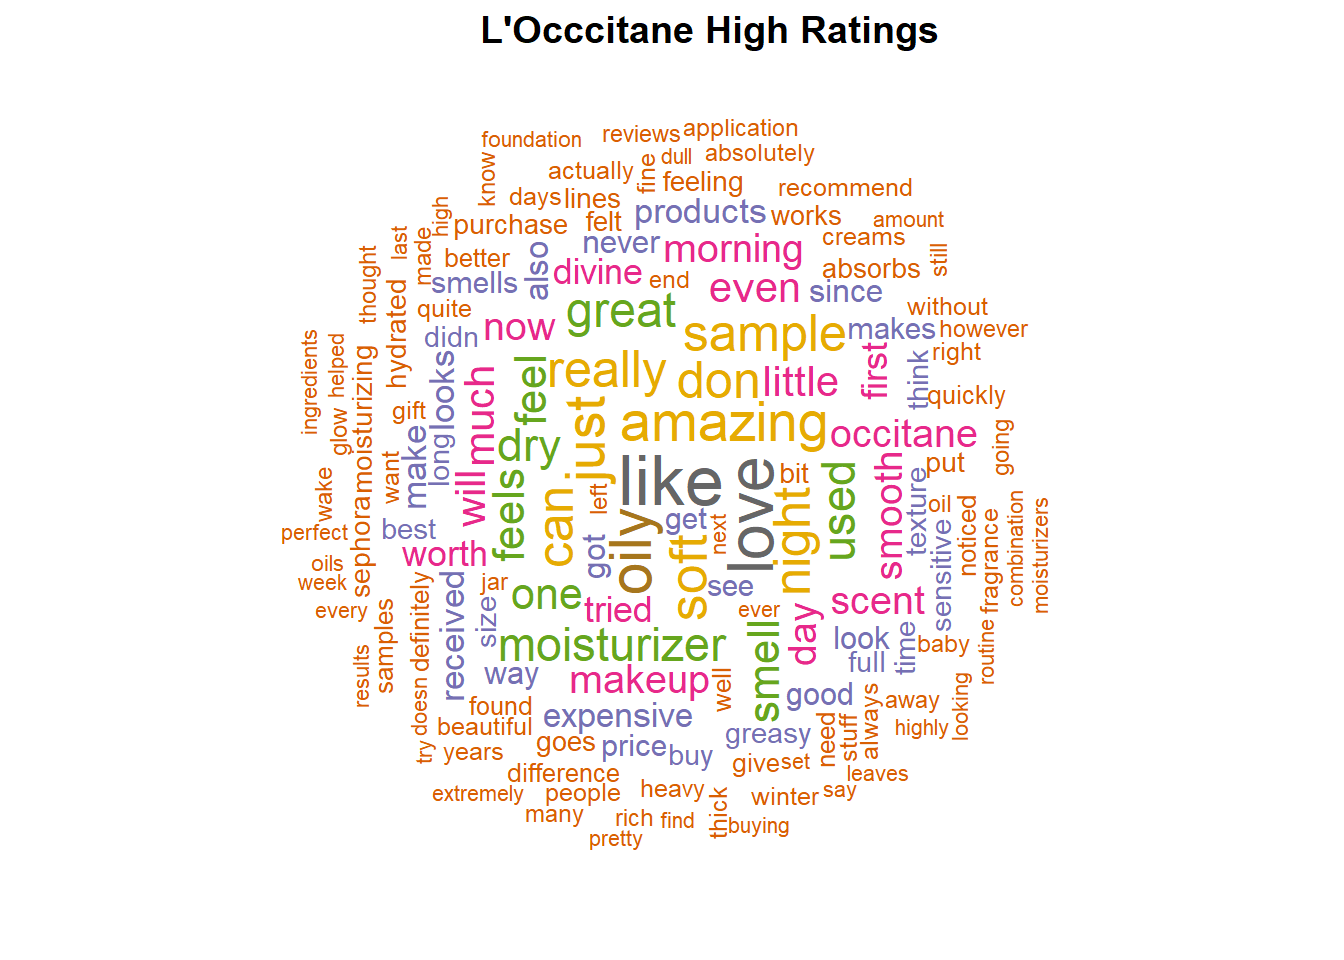
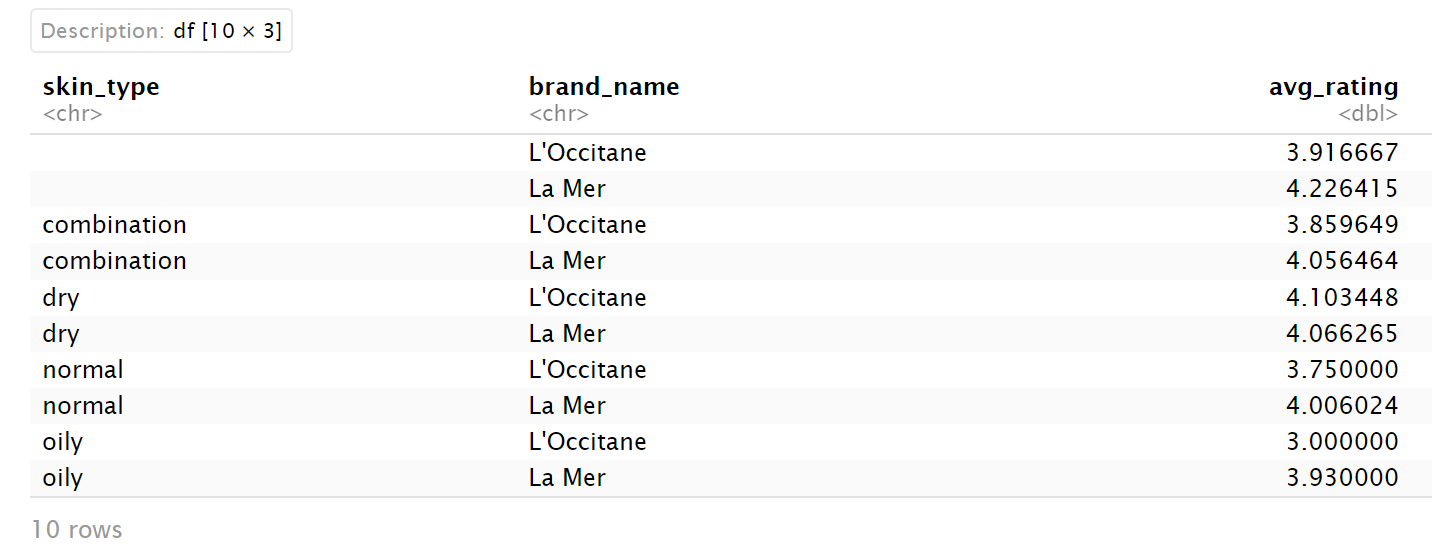
As the brand manager and data analyst, I conducted an exploratory data analysis of Sephora's product offerings, customer reviews, and category distribution using a combination of SQL and data visualizations. This analysis provided insights into consumer behavior, seasonal patterns, pricing, and product perception. A distribution of star ratings showed a strong positive skew, with most products rated 4 or 5 stars — confirming Sephora’s high overall customer satisfaction. However, a breakdown of review ratings by skin tone revealed interesting variation in satisfaction across customer subgroups, which highlights the need for better personalized product recommendations. A bar chart of average rating by month uncovered a seasonal spike in positive reviews in May, potentially aligning with Sephora’s promotional calendar or spring product launches. I also explored product availability by category, finding that Skincare and Makeup dominate Sephora’s inventory, while categories like Men and Mini Size are underrepresented — suggesting opportunities for growth. Visualizing the average product price by skincare product highlights revealed that features such as “Black Owned at Sephora” and “Anti-Aging” were associated with the highest price points, while clean beauty features like “Cruelty-Free” and “Vegan” appeared on more affordable products — a signal that clean beauty is being democratized. Additionally, price distribution plots showed that the vast majority of Sephora’s offerings fall below $100, supporting the perception of accessibility despite luxury positioning. Lastly, a lollipop chart analyzing average ratings by skin type found that customers with dry skin gave the highest ratings on average, reinforcing the importance of ingredient transparency and hydration-forward product marketing. These findings helped me understand key product gaps, consumer preferences, and areas of untapped potential — all of which would later inform my product strategy and seasonal campaign planning.
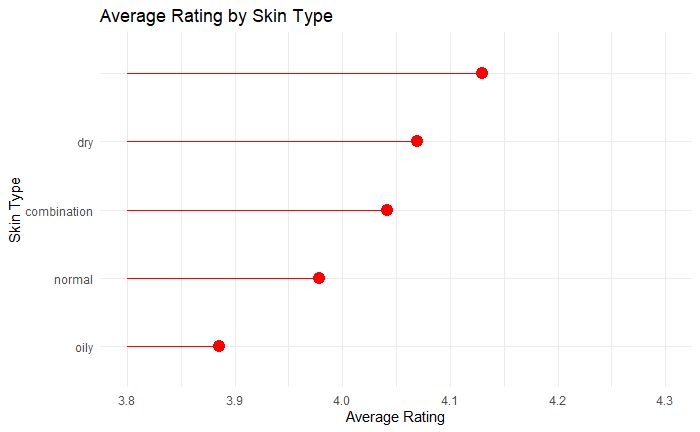
There were subtle but meaningful differences in average product ratings across skin types, which could help inform product development or personalized recommendations. Based on these findings and the social media listening frameworks we studied in class, I proposed a campaign titled “Your Skin. Your Story.” The campaign is built on the Dragonfly model—focusing on personalization, grabbing attention through bold visuals and user-generated content, encouraging customer participation through storytelling, and linking to practical tools like a skin-type product finder. Using the STEPPS framework, the campaign taps into social currency by featuring real customers, uses emotional storytelling, and provides practical skincare guidance. The campaign would launch on Instagram and TikTok, targeting high engagement periods (like Wednesday evenings) and measuring success through engagement metrics, sentiment shifts, and UGC participation. Recognizing that people leave reviews for a variety of reasons—from expressing loyalty to venting frustration—I prioritized an inclusive strategy that centers authenticity and builds trust. This project demonstrates how brands can use customer data not just to measure performance but to build deeper relationships with their audience.
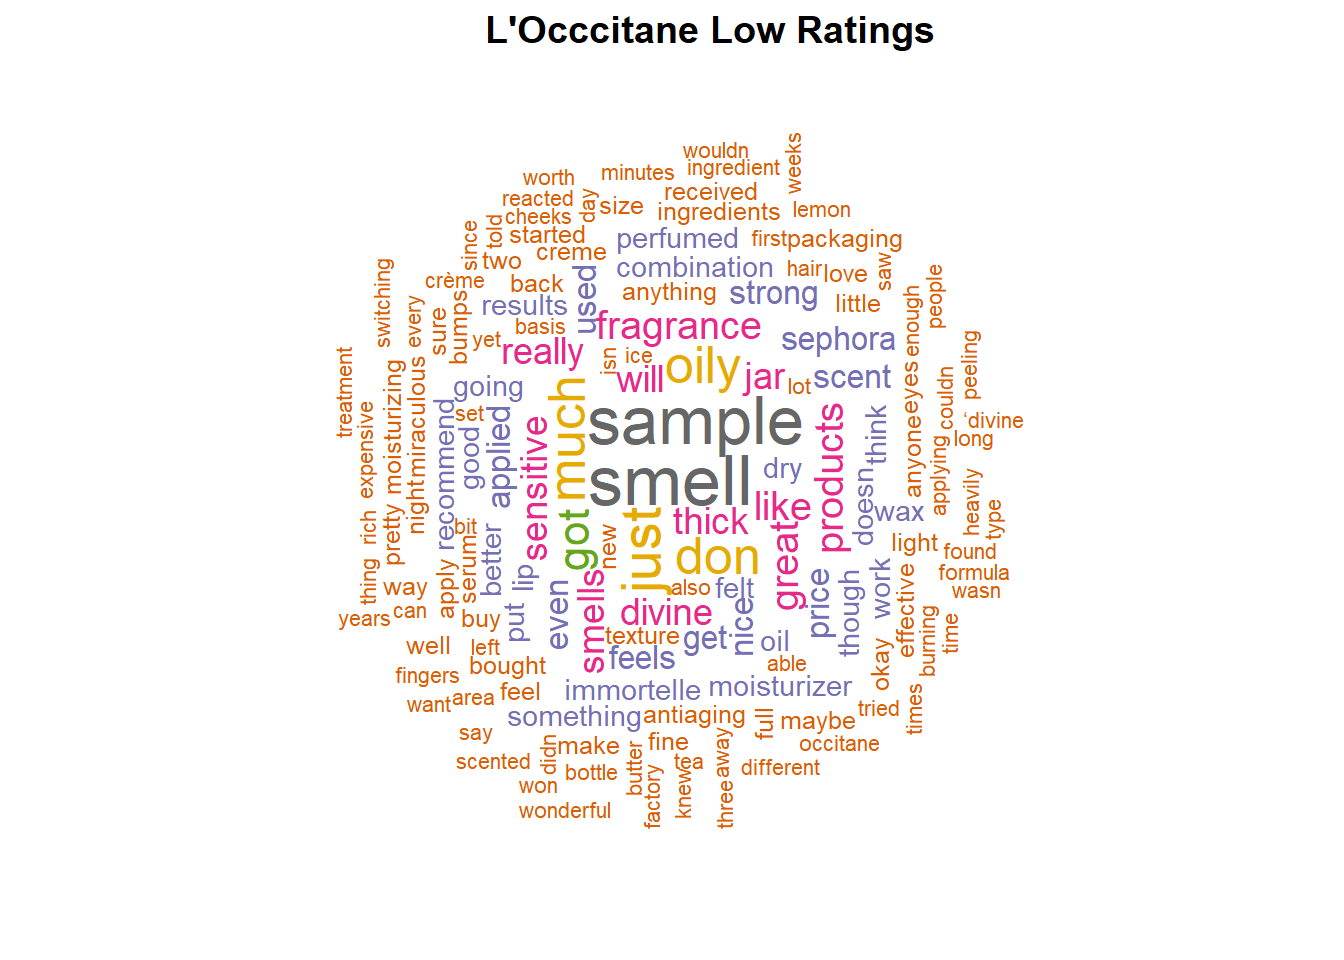
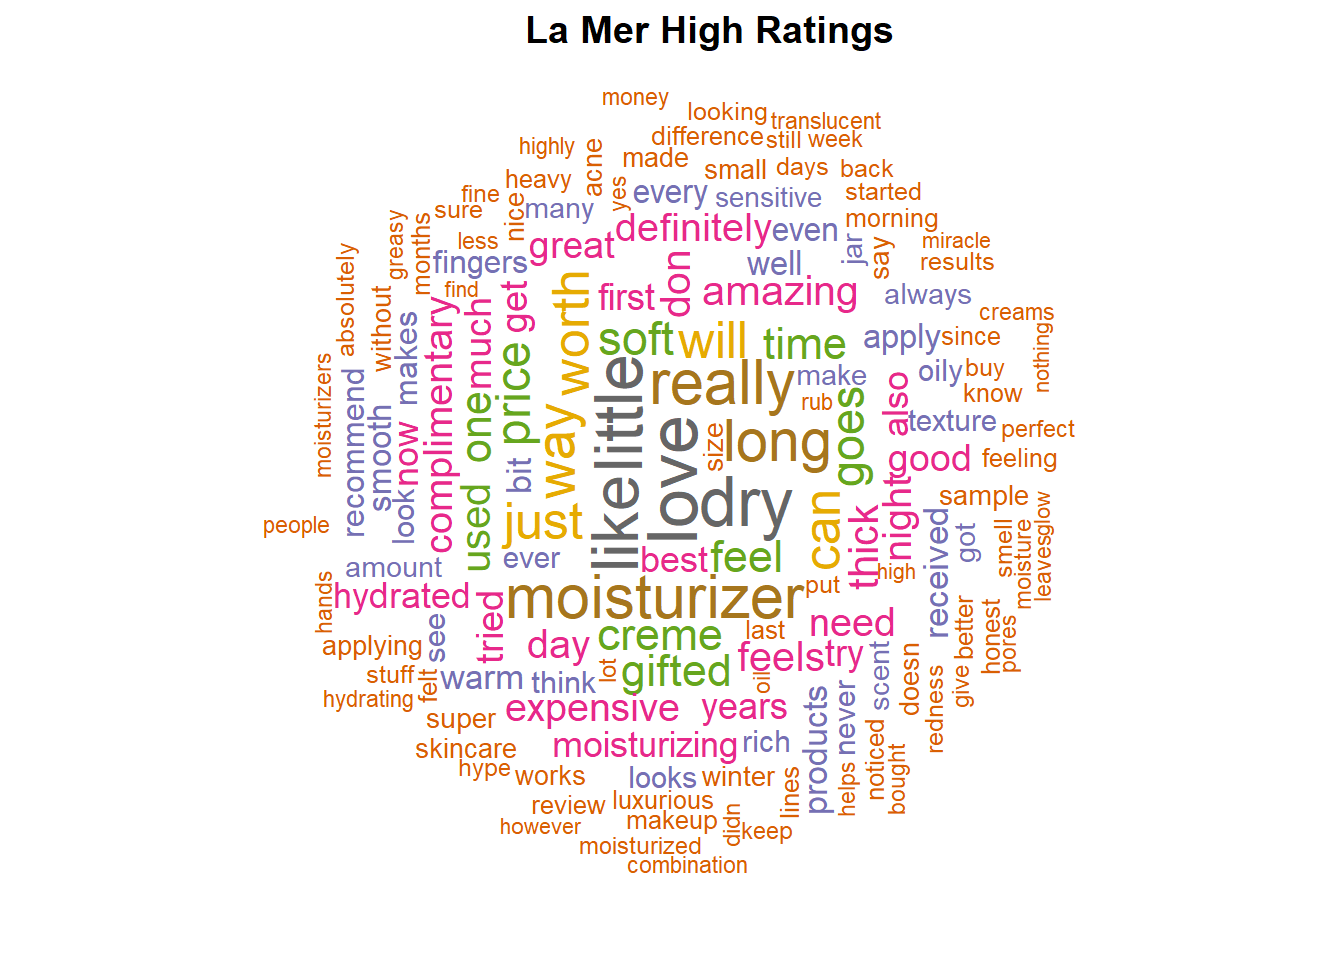
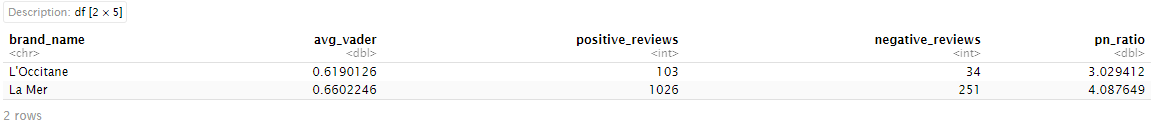
To evaluate how L’Occitane and La Mer are perceived by customers, I compared two sentiment scoring methods: the VADER sentiment analysis, which scores the tone of review text, and a Positive-to-Negative (P/N) Ratio based on star ratings. VADER revealed that both brands have generally positive sentiment, with La Mer averaging a slightly higher compound score (0.66) than L’Occitane (0.62). The P/N ratio, calculated by dividing the number of 4- and 5-star reviews by 1- and 2-star reviews, showed a similar trend: La Mer had a ratio of 4.09 compared to L’Occitane’s 3.03.While both metrics pointed to La Mer having a slight sentiment edge, they offer different insights. The P/N ratio is useful for a high-level snapshot of customer satisfaction, but it treats all high-star reviews equally and overlooks review tone. VADER, on the other hand, captures emotional nuance — recognizing when a 4-star review includes critical feedback or when a 3-star review is phrased positively. This dual-method approach demonstrated that while La Mer may have a slightly higher volume of positive feedback, L’Occitane reviews carry similarly favorable sentiment in tone. Together, these insights help contextualize customer perception and guide brand messaging.
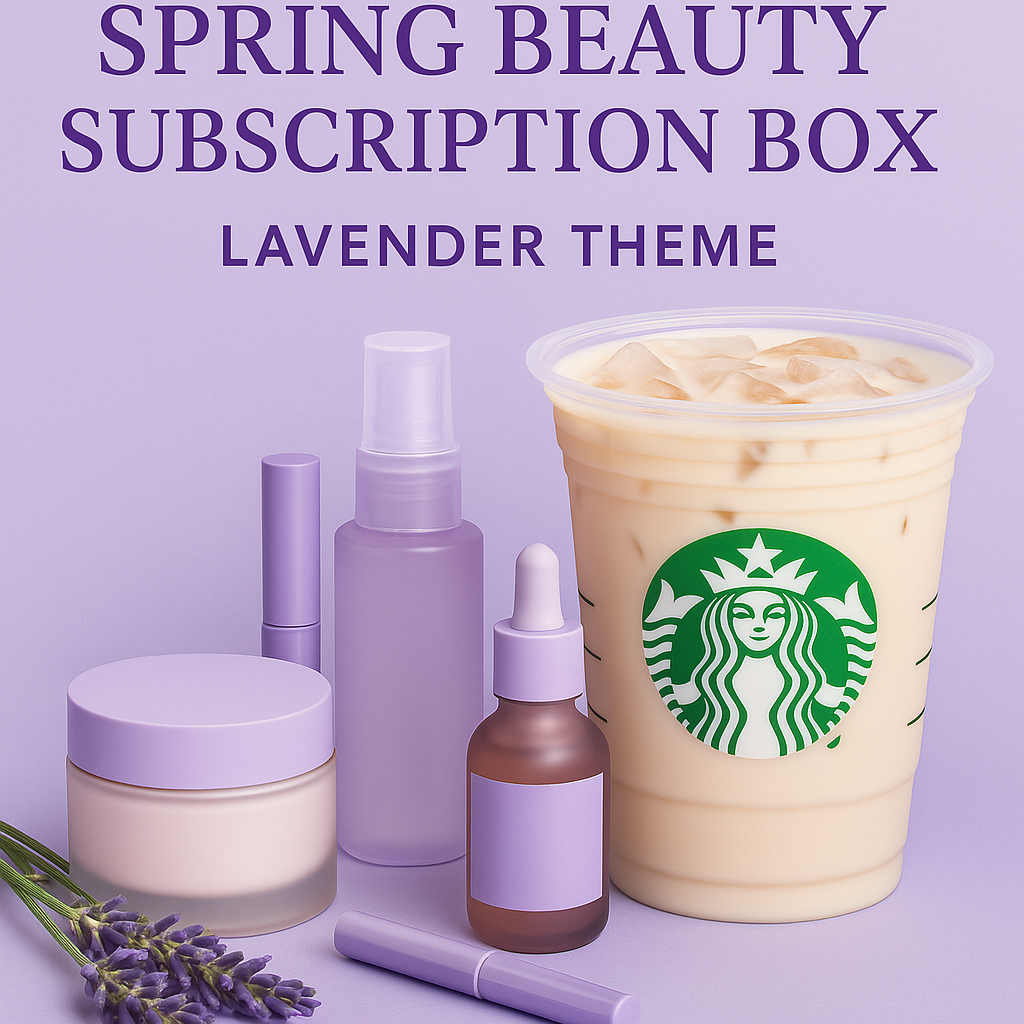
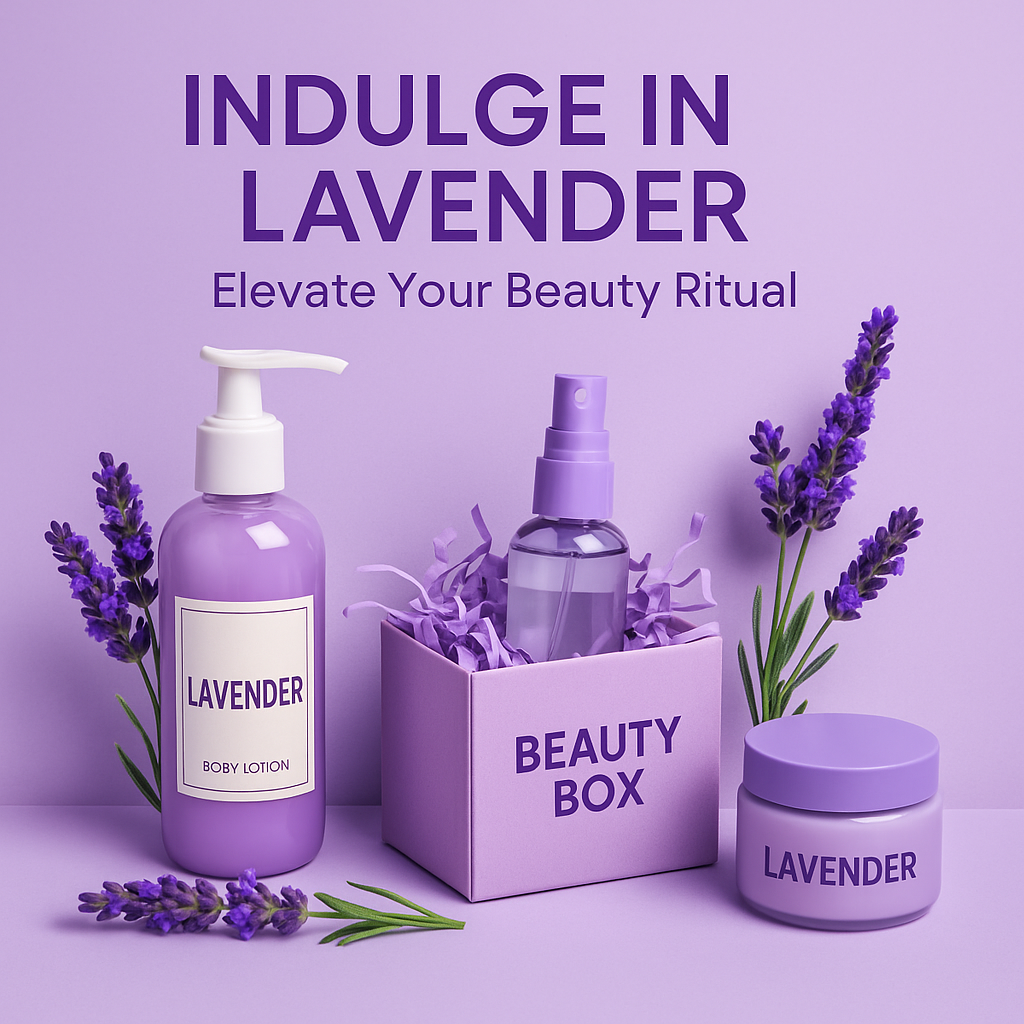
As part of Sephora’s seasonal subscription box strategy in collaboration with Starbucks, I applied the Customer-Centric Framework to design a spring-themed beauty box inspired by Starbucks’ Iced Lavender Oatmilk Latte. This collaboration focused on delivering an experience that aligned with how customers want to feel in spring: calm, renewed, and reenergized. To develop both the product mix and the marketing campaign, I identified data sources and conducted analytics that centered the customer’s seasonal mindset, behavior, and aesthetic preferences. In addition to analyzing review sentiment, ingredient trends, and skincare preferences, I proposed collecting several new types of data to better inform product and campaign design. These included:
Search & social data to track interest in lavender beauty trends, clean ingredients, and seasonal skincare rituals across TikTok, Instagram, and Google.
Customer segmentation data from Sephora’s Beauty Insider program, such as skin concerns, tone preferences, and past purchases of scent-forward or mood-based products.
Starbucks loyalty insights (where available) on users who frequently buy seasonal drinks like lavender lattes, to identify overlapping lifestyle behaviors.
Survey and micro-A/B testing data, such as testing variations in product pairings (e.g., toner + blush vs. mask + balm), packaging designs, and bundle names to identify what resonates emotionally and visually with spring shoppers. From an analytics perspective, I would perform:
Sentiment analysis of reviews for products with calming or lavender ingredients to understand emotional language and tone
Purchase pattern clustering to identify seasonal beauty shoppers who switch up routines in spring
Keyword frequency and co-purchase analysis to surface common pairings (e.g., facial mist + cream blush) for bundling
Engagement funnel metrics on campaign performance: CTR from launch email → subscription → box retention → full-size product conversion
Based on these insights, I recommended a Spring “Lavender Latte” Box featuring products that aligned with customer expectations for sensorial, relaxing, clean beauty. Suggested items included:
- avender-tinted lip and cheek stain
- soothing lavender face mist or toner
- Exfoliating lavender sugar scrub cubes
- cooling jelly-textured eye mask
- Starbucks-inspired sticker sheet or QR code for a lavender latte reward
Each item is small-format, clean-formulated, sensorial, and visually aligned with spring’s pastel palette. The box would launch on social and in-app mid-March, when lavender drinks debut and skincare customers begin shifting to lighter, glow-focused routines. By grounding the box design in customer insights and behavioral data, this approach ensures the collaboration is not only trend-forward but emotionally resonant — offering customers not just products, but a seasonal ritual.
The development of The Family Forum involved a comprehensive approach, starting with extensive research to identify the specific needs and pain points of family-owned businesses. I collaborated closely with the SBDC team to design a curriculum that was both relevant and accessible to a broad audience. The series was structured into several episodes, each focusing on a key area of family business management. Expert interviews, case studies, and practical tips were integrated to provide a well-rounded learning experience.
.png)